Causes and clinical significance of the ECG phenomenon of ST segment depression
A.A.Yalymov1, G.G.Shekhyan1, A.M.Shikota1, V.S.Zadionchenko1, O.M.Sherstyannikova2, E.F.Tugeeva2, E.U.Asymbekova2 1 State Budgetary Educational Institution of Higher Professional Education MGMSU named after.
A.I. Evdokimov, Ministry of Health of the Russian Federation; 2FGBU Scientific Center for Cardiovascular Surgery named after. A.N. Bakuleva RAMS The relevance of differential diagnosis of the causes of ST segment depression on the electrocardiogram (ECG) is due to the high frequency of pathological conditions underlying it, the difficulty of diagnosis and significant differences in therapeutic tactics and prognosis of diseases. The assessment of the ECG phenomenon of ST segment depression is complex and includes an analysis of not only the characteristics of ST changes and other ECG components, but also the clinical picture of the disease. In most cases, detailed ECG analysis is sufficient to differentiate the main syndromes leading to ST segment depression. Changes in ST can be a variant of a normal ECG, reflect non-coronarogenic changes in the myocardium and cause acute coronary pathology requiring emergency treatment. Thus, therapeutic tactics for patients with ST segment depression are different (see table).
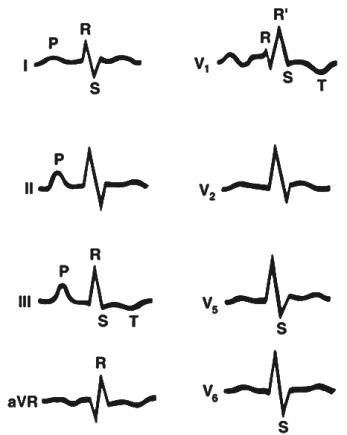
The ST segment is the segment of the ECG curve between the end of the QRS complex and the beginning of the T wave, which corresponds to the period of the cardiac cycle when both ventricles are fully excited. The ST segment begins at point J (ST junction). On the cardiogram, the J point can be determined by a change in the slope of the vertical curve of the end of the QRS complex and its transition to a horizontal position - the initial part of the ST segment. The ST segment ends with a transition to the T wave. The duration of the ST segment varies depending on the heart rate (the higher the heart rate, the shorter the ST segment). It is difficult to measure the exact duration of the ST segment, but this does not have a significant impact when deciphering the ECG. Normally, the ST segment is located on an isoline. But options are also considered normal when the ST segment is located 2-3 mm above the isoline (such a rise is usually combined with a high positive T wave), most often recorded in chest leads V2, V3. But such a pronounced elevation of the ST segment is pathological if it has a horizontal, non-rounded shape, is convex upward, or the amplitude of the T wave slightly (1 mm) exceeds the elevation of the ST segment. Normally, the reduction in the ST segment should not exceed 0.5 mm. In rare cases, a decrease in the ST segment of more than 0.5 mm may be observed in standard lead III in healthy people if the subsequent T wave is of low amplitude or negative. In Fig. Figure 1 shows different options for the location of the ST segment.
Norm and positional changes of ECG
Depression of the concave ST segment up to 0.5 mm is acceptable, in the chest leads V5–V6 and in the limb leads up to 2–3 mm. Positional changes in the ventricular complex sometimes mimic signs of myocardial infarction in the inferior wall of the left ventricle (LV) on the ECG. Positional changes differ from myocardial infarction in the absence of the characteristic dynamics of the ST segment and T wave, as well as a decrease in the depth of the Q wave when recording an ECG at the height of inspiration or expiration (Fig. 2).
ECG for coronary insufficiency
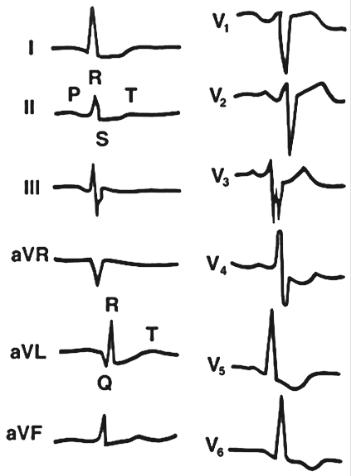
ECG changes in acute coronary insufficiency are divided into signs of ischemia (T wave fluctuations), damage (ST segment displacement) and myocardial necrosis (formation of a pathological Q wave and regression of the R wave). Their display on the ECG depends on the localization of the pathological focus in the walls of the ventricles of the heart and the location of the active ECG electrode in relation to it. Direct pathological signs are recorded in those leads in which the active electrode is directed to the lesion. In leads where the active electrode is facing the myocardium of the wall opposite to the lesion, changes in the ECG will have the opposite direction (reciprocal changes). The main signs of myocardial damage are changes in the ST segment. When damage occurs in the 2nd phase of repolarization, a potential difference occurs between the pathological focus and healthy myocardium. The damage current is directed towards the pathological focus and causes a displacement of the ST segment relative to the isoelectric line (Fig. 3). When the site of damage is localized in the internal subendocardial layers, a displacement of the ST segment below the isoelectric line is recorded in the direct leads. ST segment displacement can be horizontal, oblique, concave and oblique. Horizontal and oblique ST segment depression is considered the most diagnostically significant, while concave and obliquely ascending depression is considered less significant. Reciprocal changes in subendocardial damage are usually not pronounced. When the pathological focus is localized in the subepicardial layers, the direction of the damage current towards it leads to a rise in the ST segment above the isoelectric line. Reciprocal changes are manifested by ST segment depression. Similar signs are observed on the ECG with transmural damage, which is much more common than isolated subepicardial damage (Fig. 4).
ECG for LV myocardial tension syndrome (strain syndrome)
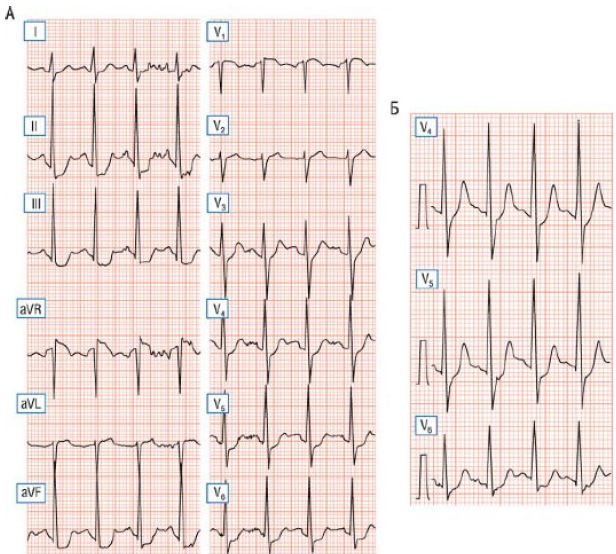
This is an ECG concept that includes ST segment depression leading to a negative asymmetrical T wave, described by Rykert and Hepburn in 1935 as a sign of LV hypertrophy (LVH); often occurs with arterial hypertension, aortic stenosis, mitral insufficiency. A revision of this concept, undertaken in 1981 by C. Beash et al., suggested that changes in repolarization in LVH without signs of coronary artery disease may differ from similar changes in coronary heart disease in several ways. Firstly, by a decrease in the J point, secondly, by the asymmetry of the T wave with a rapid return to the baseline, thirdly, by the positive final deviation of the T wave and, finally, fourthly, by the negative T wave in V6, which greater than 0.3 mV and larger than the T wave in V4. However, in clinical practice, such differentiation of signs of LV myocardial tension syndrome due to its hypertrophy from ST–T changes in coronary heart disease is most often impossible. Among the causes of strain syndrome are a decrease in coronary reserve, dysfunction of the endothelium of the coronary vessels, an increase in intracavitary pressure, and changes in the direction of currents during the period of restoration of the transmembrane potential. LVH occurs in arterial hypertension, aortic heart defects, mitral valve insufficiency, cardiosclerosis, and congenital heart defects (Fig. 5). With mitral regurgitation, the ECG shows signs of hypertrophy, dilatation and overload of the left chambers of the heart due to an increase in the volume of blood passing through them (Fig. 6). The most pathognomonic for aortic stenosis of the heart are hypertrophy and severe systolic overload of the LV, which is reflected on the ECG. 1. Signs of LVH with secondary myocardial changes in the form of the formation of oblique ST depression and negative asymmetric T waves in I, aVL, V4–V6. 2. Block of the left bundle branch (LBB) is often detected (Fig. 7).
ECG for hypertrophic cardiomyopathy
ECG changes are usually detected in all patients with hypertrophic cardiomyopathy (HCM), but have low specificity and are not decisive in making a diagnosis. Typically, the ECG shows symptoms of hypertrophy of different parts of the heart (LV, interventricular septum, left atrium, and less commonly, right ventricle - RV). The ECG picture will be different for different forms of the disease (asymmetric septal, concentric and apical). ECG signs: 1. Increased amplitude of R waves. 2. Appearance of pathological Q waves in leads I, aVL, V5, V6, less often – II, III , aVF, which reflect the passage of an electrical impulse along the hypertrophied interventricular septum. 3. ECG signs of severe LVH with secondary changes in its myocardium (downward ST depression and asymmetric negative T wave in leads I, aVL, V5, V6). In the apical form of the disease, negative T waves can be recorded in all chest leads. 4. Rhythm and conduction disturbances (most often - blockade of the branches of the FN of the His bundle and ventricular arrhythmias). 5. More rare in HCM are ECG signs of enlargement of the left atrium (R-mitrale) and RV (Fig. 8). ECG with pericarditis The most characteristic ECG sign of pericarditis is a concordant (unidirectional with the maximum wave of the QRS complex) displacement of the ST segment in most leads. These changes are a reflection of damage to the subepicardial myocardium adjacent to the pericardium. In the ECG picture of pericarditis, a number of stages are distinguished (Fig. 9): 1. Concordant ST shift (ST elevation in those leads where the maximum wave of the ventricular complex is directed upward - I, II, aVL, aVF, V3-V6, and ST depression in leads where the maximum wave in the QRS is directed downwards - aVR, V1, V2, sometimes aVL), turning into a positive T wave. 2. The ST segment approaches the isoline, the T wave is smoothed out. 3. The T wave becomes negative in most leads (except aVR, where it becomes positive). 4. Normalization of the ECG (smoothed or slightly negative T waves can persist for a long time). Sometimes with pericarditis, involvement of the atrium myocardium in the inflammatory process is observed, which is reflected on the ECG in the form of a displacement of the PQ segment (in most leads - PQ depression), the appearance of supraventricular arrhythmias. With exudative pericarditis with a large amount of effusion on the ECG, as a rule, there is a decrease in the voltage of all teeth in most leads.
ECG for myocarditis
ECG changes in myocarditis are non-specific and are manifested mainly by changes in the ST segment and T wave: ST depression, flattened, biphasic or negative T wave (in leads reflecting the localization of the inflammatory process). Also characteristic are sinus tachycardia, a decrease in QRS voltage (with diffuse damage) and the appearance of various rhythm and conduction disturbances - intraatrial block, bundle branch block, AV block of varying degrees.
1. Alpert D., Francis G. Treatment of myocardial infarction. Practical guide. M.: Praktika, 1994. 2. Heart disease: A guide for doctors. Ed. R.G.Oganova, I.G.Fominoy, M.: Litterra, 2006. 3. Dzhanashiya P.Kh., Kruglov V.A., Nazarenko V.A., Nikolenko S.A. Cardiomyopathies and myocarditis. M., 2000; With. 66–9. 4. Isakov I.I., Kushakovsky M.S., Zhuravleva N.B. Clinical electrocardiography. L.: Medicine, 1984. 5. Clinical arrhythmology. Ed. A.V. Ardasheva. M.: MEDPRACTIKA-M, 2009. 6. Kushakovsky M.S., Zhuravleva N.B. Arrhythmias and heart block (atlas of electrocardiograms). L.: Medicine, 1981. 7. Orlov V.N. Guide to electrocardiography. M.: Med. information agency, 1999. 8. Guide to electrocardiography. Ed. V.S.Zadionchenko, Saarbrucken, Germany. LAP LAMBERT Academic Publishing GmbH&Co. KG. 2011; c. 323. 9. Topolyansky A.V., Talibov O.B. Emergency cardiology: Handbook. Under general ed. A.L.Vertkina, M.: MEDpress-inform, 2010. 10. Beach C, Kenmure ACF, Short D. Electrocardiogram of pure left ventricular hypertrophy and its differenciation from lateral ischaemia. Br Heart J 1981; 46:285–9. 11. Braunwald E, Antman E, Beasley J et al. ACC/AHA 2002 guideline update for the management of patients with unstable angina and non-ST-segment elevation myocardial infarction: summary article:a report of American College of Cardiology/American Heart Association Task Forceon Practice Guidelines (Coommittee on the Management of Patients With Unstable Angina). J Am Coll Cardiol 2002; 40: 1366. 12. Drazner MH, Rame JE, Marino EK. Increased left ventricular mass is a risk factor for the development of a depressed left ventricular ejection fraction with five years: the cardiovascular heart study. Am J Coll Cardiol 2004; 43:2207–15. 13. Huwez FU, Pringle SD, Macfarlane PW. Variable patterns of ST-T abnormalities in patients with left ventricular hypertrophy and normal coronary arteries. Br Heart J 1992; 67:304–7. 14. Kannel WB, Gordon T, Castelli WP, Margolis JR. Electrocardiographic left ventricular hypertrophy and risk of coronary artery disease. Ann Intern Med 1970; 72:813–22. 15. Okin PM, Devereux RB, Nieminen MS et al. Electrocardiographic strain pattern and prediction of new-onset congestive heart failure in hypertensive patients. Circulation 2006; 113:67–73. 16. Okin PM, Devereux RB, Nieminen MS et al. Electrocardiographic straine pattern and prediction of cardiovascular morbidity and mortality in hypertensive patients. Hypertension 2004; 44:48–54. 17. Pansa JA, Laurienzo JM, Curiel RV et al. Investigation of the mechanism of chest pain in patients with angiographically normal coronary arteries using transesophageal dobutamine stress echocardiography. J Am Coll Cardiol 1997; 29: 293–301. 18. Rykert HE, Hepburn J. Electrocardiographic abnormalities characteristic of certain cases of arterial hypertension. Am Heart J 1935; 10: 942–54. 19. Vogt M, Mots W, Strauer BE. Coronary haemodynamics in hypertensive heart disease. Eur Heart J 1992; 13(Suppl. D): 44–9.
www.medicusamicus.com
ST segment - what is it and what is it responsible for?
A segment on an ECG is a section of the curve that is located between adjacent teeth
As you know, only a doctor should decipher a cardiogram. It is very difficult for an untrained person to understand graphs. The ECG procedure itself is carried out very quickly, but at the same time it is quite informative.
It shows heart rate, heart rhythm, ventricular contractions, etc. The entire graph consists of various lines and segments, each of which performs its own function. It is worth remembering that it is necessary to evaluate the result completely; information solely on one segment will not yield much.
ST segment depression is not a disease, but an abnormality in the cardiogram. There may be several reasons for this condition and it is difficult to determine them without further examination.
The peculiarity of this segment is as follows:
- The segment is located between points S and T, and the S wave is always negative, that is, it is below the isoelectric line. The T wave is usually located higher.
- This segment is assessed holistically, but in most cases it shows how well the myocardium is saturated with oxygen.
- The size of the segment depends on the heart rate. The more often the heart contracts, the shorter this section is.
- The ST segment reflects the period of heart activity when both ventricles are in a state of excitation.
- The ST section is always horizontal and located approximately at the level of the isoelectric line. However, if it is slightly higher (a couple of cells), then this is also considered normal.
Particular attention is paid to this area when diagnosing coronary artery disease and suspected myocardial infarction.
A segment is said to be depressed if it has dropped below the isoelectric line by more than half a millimeter.
However, further examination of the heart, blood tests, etc. are required to make a diagnosis and determine the causes. In some cases, even segment depression may be a sign of normality. Not only the depth of the segment’s depression relative to the isoelectric line is taken into account, but also its displacement, the location of the teeth, curvature, slope, and the location of other teeth.
Stress ECG (stress ECG)
The stress ECG (stress ECG) was proposed in the 1960s to improve the diagnostic sensitivity of the resting ECG in patients with coronary artery disease by reproducing the conditions under which angina most commonly occurs. Physical activity increases sympathetic tone and decreases parasympathetic tone, increasing heart rate and blood pressure - the main factors determining myocardial oxygen consumption. Exercise can also precipitate arrhythmias and AV block, so exercise testing has become a very useful tool in the evaluation of patients with chest pain, shortness of breath, or exercise-induced syncope. In patients with severe heart disease, such as aortic stenosis or unstable angina, exercise testing should be avoided or, if it is determined to be necessary to make the diagnosis, testing should be performed with special precautions.
Physical activity is applied in accordance with “increasing” protocols, which include an adaptation phase followed by progressively increasing physical activity with a 2-3 minute stabilization period before the next increase in load. Different protocols are used for strong, young, trained people (rapid increase in load) and elderly, weakened patients (slow increase in load).
Typically, testing is performed on a treadmill, where the incline and speed are changed every 2-3 minutes, but bicycle ergometers can also be used, in which the load is changed by increasing the resistance of the pedals. Good patient adaptation to the testing equipment is necessary to allow a correct assessment of functionality.
Exercise testing requires special equipment to record ECG data to avoid problems caused by movement and muscle artifacts. To stabilize the isoline, special filters are used, and the location of the electrodes is not identical to the standard resting ECG. Arm electrodes are usually placed in the upper chest and leg electrodes in the upper abdominal wall to reduce motor influences. Thus, ECG vectors may change to such an extent that they must be analyzed in conjunction with the original ECG taken in a standing position in the exercise electrode configuration
Exercise test for ischemic heart disease
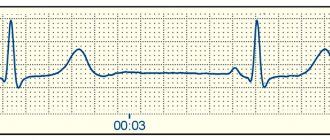
A simple “double product” [heart rate (per minute) × systolic blood pressure] is linearly related to myocardial oxygen consumption, which allows the assessment of blood flow reserve in the coronary arteries. In addition to increasing oxygen demand, exercise leads to peripheral vasodilation in areas supplied by both normal and stenotic arteries, causing a steal phenomenon in which collateral blood flow under conditions of exercise is redistributed to well-supplied regions. Thus, an exercise test allows one to reproduce the mechanisms of myocardial ischemia and assess the reserve of coronary blood flow under control. The most reliable sign of ischemia is horizontal (flat) ST segment depression from the end of the QRS complex (J point) to the beginning of the T wave.
The T wave may also become inverted, but isolated T wave inversion is not a reliable sign of ischemia. To increase the specificity of the test, it is mandatory to use a depression cutoff value of 1.5 mm (-0.15 mV). Even ST segment depression may have poor predictive value in women or patients with baseline ST segment depression associated with drugs (digitalis) or LV overload (hypertension). Registration of a large number of ECG leads does not allow localizing the true ischemic zone based on ST segment depression.
A - ischemic response to exercise. Note the horizontal ST segment depression in leads II, III, and aVF, and the mild obliquely ascending ST depression in leads V5-V6 that persists for 80 ms from the J point. B - Normal ST segment depression in V5-V6 associated with Ta wave. Note that the ST segment becomes isoelectric 80 ms after the J point.
Ischemic depression of the ST segment must be differentiated from rapid oblique depression that develops in healthy people at high heart rates, which disappears in less than 80 ms. This “normal” J-point depression is attributed to the atrial repolarization (Ta) wave. Secondary changes in the ST segment and T wave associated with hypertrophy, RBBB, and preexcitation are not interpreted during exercise. Hyperventilation can lead to ST-segment depression in the absence of coronary artery disease, and some protocols include a pre-exercise voluntary hyperventilation test to assess this effect. The predictive value of ST segment depression is much lower in women than in men.
ST segment elevation during exercise is a sign of severe ischemia associated with critical proximal coronary artery stenosis. However, ST segment elevation may be associated with coronary artery spasm without significant fixed stenosis. Areas of dyskinesia or aneurysm during exercise may also cause ST-segment elevation in the absence of severe ischemia.
The exercise test is an important tool in determining prognosis, increasing the predictive value of the angiographic picture. It can be useful in selecting pharmacological therapy, identifying patients whose high-grade angina has a dual cause and who may benefit most from lowering blood pressure or controlling heart rate using adrenergic blockers or other drugs. This applies to those patients with angina in whom, with a low heart rate and low blood pressure, the need for revascularization becomes obvious.
Features of Prinzmetal's angina
This is a special type of angina in which the attack occurs at rest or during normal daily activities and is not associated with any stress.
The ECG is characterized by the presence of ST elevation with a transition to a positive T wave. As a result, a monophasic curve is recorded. On the opposite wall of the myocardium there will be reciprocal changes (reverse to the existing ones), i.e. a decrease in the ST segment.
Changes in Prinzmetal's angina last for some time, and then return to the original level. It is assumed that this occurs due to incoming spasm of the coronary arteries.
The most common important changes in the ST segment and T wave include those that are characteristic of myocardial ischemia and infarction. Since ventricular repolarization depends on myocardial perfusion, patients with coronary disease often exhibit reversible changes in the ST segment and T wave during transient myocardial ischemia.
Let us remember that pathological Q waves serve as indicators of myocardial infarction, but do not allow us to distinguish an acute one from one that occurred a week or a year ago. But during acute myocardial infarction, a series of characteristic changes in the ST segment and T wave occur, allowing one to differentiate between acute and non-acute myocardium (Fig. 4.24). In acute Q wave myocardial infarction, ST segment elevation is the first to appear, often accompanied by a tall T wave. At this early stage, myocardial cells are still viable and Q waves are not yet recorded. However, after a few hours, the death of myocytes leads to a decrease in the amplitude of the R wave and the appearance of pathological Q waves in the ECG leads located above the infarction zone. In the first two days from the onset of a heart attack, the ST segment rises, the T wave becomes negative, and the Q wave deepens. After several days, the ST segment returns to the baseline, but the T waves remain negative.
Weeks and months after a heart attack, the ST segment and T waves become normal, but abnormal Q waves remain, which is an invariable sign of myocardial infarction. If the ST segment remains elevated after several weeks, then there is a possibility of formation of a bulging fibrous scar (ventricular aneurysm) at the site of the infarction. A similar evolution of changes in the QRS complex, ST segment and T waves is recorded using leads located above the infarction zone (Table 4.3). In this case, as a rule, reciprocal changes are observed in leads located on the opposite side. For example, in acute anterior septal MI, ST segment elevation in precordial leads x and V2 is accompanied by reciprocal changes (ST depression) in leads II, III and aVF, i.e. in leads lying above the opposite (lower) wall of the heart ventricle.
The mechanism of ST segment elevation during acute MI is not yet completely clear. However, there is an opinion that such changes occur from damaged myocardial cells located directly near the infarction zone; they excite abnormal systolic and diastolic currents. Objecting to this explanation, others believe that such cells are not capable of depolarization, but have an abnormal permeability that does not allow them to fully repolarize (Fig. 4.25). As a result, in a state of rest, partial depolarization of such cells causes the appearance of forces directed away from the damaged segment, causing a downward shift of the isoline. Due to the fact that the electrocardiograph records only the relative, and not the absolute, voltage value, the deviation of the isoline is not captured. As all myocardial cells, including those in the affected area, become completely depolarized, the resulting electrical potential of the heart actually becomes zero. However, due to a pathological downward displacement of the isoline, the ST segment appears to be located above the isoline. During the process of repolarization, the damaged cells return to an abnormal state of increased permeability in diastole, and the ECG again displays an abnormal shift in the basal line due to the presence of abnormal forces directed away from the electrode. Thus, the relative displacement of the isoelectric line has a certain influence on the magnitude of ST segment elevation during MI.
With non-transmural myocardial infarction, in the leads crossing the area of the infarction, there is a decrease in the ST segment, not its elevation. In this situation, the diastolic permeability of damaged cells adjacent to the infarct area causes the appearance of electrical forces directed from the endocardium to the epicardium and, therefore, towards the ECG electrodes. Thus, the basal line of the ECG is shifted upward (Fig. 4.25). After complete depolarization of the heart, its electrical potential returns to its true zero value, but relative to the abnormal basal line creates an apparent depression of the ST segment.
Rice. 4.25. Theoretical explanation for the occurrence of ST abnormalities during acute MI. Upstairs. Ion leakage causes partial depolarization of the cell of the damaged myocardium before the process of propagation of electrical excitation begins, which causes the appearance of forces directed away from the affected area and a decrease in the basal line of the ECG. But this process is not displayed on the ECG, since it records the relative, not the absolute, voltage value. While the heart is completely depolarized, the true voltage is zero, but there is an apparent ST segment elevation relative to the abnormally low baseline. At the bottom. In non-transmural MI, the process proceeds in a similar way, but ion leakage occurs from the subendocardial tissue, so that the partial depolarization preceding excitation is directed towards the recording electrode; therefore, the basal line is elevated. After depolarization ends, the voltage is indeed zero, but the ST segment appears slightly depressed relative to the upwardly shifted basal line
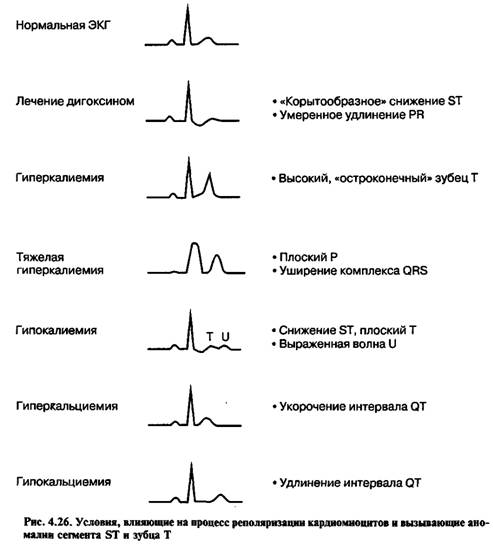
Other common causes of changes in the ST segment and T wave associated with disturbances in the process of cardiomyocyte repolarization are described in Fig. 4.26.
When interpreting an ECG
the isoelectric line is usually taken to be the PQ interval. The TP segment represents a true contour line, but is practically not used in most routine clinical measurements. The appearance of J-point depression > 0.10 mV (1 mm) from the PQ transition level with a relatively flat ST segment (eg, 0.10 mV and duration 80 ms after the J-point (ST 80) for three consecutive cardiac cycles with stable isolines are considered a pathological response.As a rule, an ST 60 measurement should be taken whenever the heart rate is > 130 beats/min. ST segment depression can be observed at rest.
In this case, point J
and ST 60 or ST 80 must further decrease by >0.10 mV to be considered abnormal. Most laboratories print ECGs in 3x4 or 2.5 sec format for a group of three leads. To increase compliance with the above criteria, some laboratories have adopted a strategy of recording ECGs in leads II, aVF, and V5 for 10 seconds after changes below the ischemic threshold occur.
This is a 10 second recording
increases the likelihood of identifying several consecutive pathological cardiac cycles with a stable isoline.
When ST segment depression
is >0.1 mV, stress becomes less specific and imaging should be considered. In patients with early repolarization and ST segment elevation at rest, a return to the PQ transition level is normal, so the degree of FN-induced ST segment depression in patients with early renolarization should be determined from the level of the PQ interval, and not from the elevated position of the J point before the test.
ST segment depression
, induced by load, not only does not determine the localization of myocardial ischemia, but does not even indicate which coronary artery it is associated with. Unlike depression, exercise-induced ST-segment elevation is relatively specific in identifying the area of ischemia and the coronary artery that may be causing that ischemia.
Stress ECG for other heart diseases
As discussed above, exercise-induced changes in autonomic nervous system tone can have a significant impact on heart rate. Nodal AV block may improve or disappear with exercise, while bundle branch AV block or trifascicular RBBB may be precipitated by exercise, causing symptoms such as shortness of breath or syncope during exercise. Atrial and ventricular tachycardias caused by focal activity, or some re-entry tachycardias associated with accessory pathways (for example, the continuous tachycardia of Comel described by P. Coumel, can also be provoked by physical activity, which makes it possible to establish a diagnosis and prescribe effective treatment. In patients with In persistent atrial fibrillation, exercise testing is helpful in assessing ventricular rate control. In patients with WPW, exercise testing has previously been used to assess accessory tract refractory period as an attempt to weigh the risk of accelerated AV conduction in atrial fibrillation, but its predictive value has been is small, and therefore this method is practically not used in the era of catheter ablation.
cardiolog.org
Why do an ECG?
Analysis of the state of the CT segment in the electrocardiogram remains a very relevant method of modern diagnostics. Using an ECG, you can detect cardiac pathologies in the early stages and begin their therapy. Therapeutic practice shows that the treatment and prognosis of many of these diseases depend on the stage of pathology at which they are diagnosed.
Timely diagnosis of cardiac pathologies will protect against serious complications
It is possible to assess how strongly the CT segment has shifted only in combination with other cardiac parameters. Depression or elevation in itself does not necessarily indicate pathology; it may be part of the norm.
When considering the results of electrocardiography, one cannot ignore the symptoms that appear. Displacement of the CT segment may be associated with non-coronarogenic changes in the myocardium.
Important! In rare cases, segment displacement may be a sign of acute coronary syndrome. This requires emergency medical attention.
General information about segment offset
When a person is healthy, his ECG is normal. Elevation of the st segment (rise) or decrease may indicate pathologies within the body. Normally, the st segment is located on an isoline, although there is a certain range of acceptable values.
ST depression is acceptable in limb leads up to 0.5 mm. Indicators greater than or equal to 0.5 in leads V1-V2, 0.5 are considered a deviation.
St segment elevation in the limb leads should be less than 1 mm. For leads V1-V2, the norm is up to 3 mm, and for V5-V6 – up to 2 mm.
What does ST segment depression mean in an electrocardiogram?
- July 23, 2018
- Psychiatry
- Evdokimova Irina
Sometimes in the transcript of the electrocardiogram the doctor writes about ST-segment depression. In some cases, this is a sign of pathology, but it can also be a normal variant. Patients do not always understand this term, so you should understand in more detail the reasons for this ECG result.
What is the ST segment?
An ECG shows the electrical processes that occur in the heart muscle during contraction and relaxation. If you look at the result of the study, you can see a line with many teeth. A straight segment is called an isoline, and the distance between two adjacent teeth is called a segment.
The ST segment represents the interval from the end of the S wave to the beginning of the T wave. This segment shows the state of the heart muscle at the time of contraction of both ventricles. Normally, the segment lies completely on the isoline and does not deviate from it. If the segment is located below the isoline, then doctors talk about depression of the ST segment.
Does this indicate a dangerous heart pathology? It all depends on the degree and type of segment decline. The electrocardiograph records the examination results on checkered paper.
If the ST segment is located no more than half a cell below the isoline, then this is a variant of the norm and occurs in healthy people. This result is considered acceptable in both precordial and limb leads.
A stronger decrease in the segment may indicate cardiac pathology.
Why is the ST segment reduced?
The causes of ST segment depression are divided into coronary and non-coronary. Coronary causes include conditions associated with insufficient blood supply (ischemia) to the heart muscle. These are different types of coronary heart disease and myocardial infarction. Non-coronary causes include:
- lack of potassium in the body (hypokalemia);
- secondary myocardial lesions in non-cardiac pathology;
- paroxysmal supraventricular tachycardia (ST segment depression can be up to 8 mm);
- taking certain medications (cardiac glycosides, antiarrhythmics, phenothiazines);
- hypertrophy of the left ventricle of the heart;
- vegetative dystonia;
- mitral valve prolapse;
- emotional stress;
- intense breathing (hyperventilation).
Types of segment reduction
When making a diagnosis based on electrocardiogram results, the type of ST segment depression must be taken into account. In cardiology, there are several types of such deviations:
- oblique;
- oblique;
- horizontal.
Oblique and horizontal depressions may indicate the presence of cardiac pathology. An oblique decline sometimes occurs in healthy people.
Oblique and horizontal type of decline
If the segment between the teeth is an oblique line directed downwards, then in this case they speak of oblique depression of the ST segment. Such electrocardiogram readings are considered pathological. This indicates myocardial ischemia. Another reason for this result may be left ventricular failure.
A sign of insufficient blood supply to the heart muscle is horizontal depression of the ST segment. What it is? The segment between the S and T teeth is parallel to the isoline. This ECG result is also a marker of ischemia.
The status of the ST segment is checked in two adjacent leads. That is, the electrodes of the cardiograph are connected to two points located nearby, on the chest or on the limbs. And if a decrease in the segment was detected twice, then this, as a rule, indicates ischemia.
Oblique descent type
Oblique ST-segment depression is a deviation in the electrocardiogram when the line between the teeth is directed upward. This usually happens with tachycardia. This phenomenon may be temporary, for example when your heart rate increases after exercise. In this case, changes in the electrocardiogram do not indicate pathology.
But if a high T wave is observed on the electrocardiogram along with oblique ST segment depression, this may indicate a disease. This ECG result occurs in the acute stage of myocardial infarction, with left ventricular hypertrophy, hyperkalemia.
Nonspecific depression
A decrease in the distance between the S and T waves is not always associated with coronary heart disease. This can be observed both normally and in conditions where the blood supply to the myocardium is not impaired. Typically, such a decrease is caused by non-coronary causes. In this case, doctors talk about nonspecific ST-segment depression.
Such changes in the electrocardiogram can be observed under the following conditions:
- mitral valve prolapse;
- taking cardiac glycosides, diuretics, psychotropic drugs (the ST segment has a trough-shaped shape);
- vegetative-vascular dystonia;
- left ventricular hypertrophy;
- hypokalemia;
- tachycardia;
- cardiac conduction disorders;
- hyperventilation;
- inflammation of the pancreas;
- water and electrolyte disturbances;
- Wolff-Parkinson-White syndrome (a disease with periodic attacks of tachycardia).
In some cases, there are mixed causes of ST segment depression. For example, a patient may suffer from left ventricular hypertrophy and at the same time use cardiac glycosides. This can lead to the development of myocardial ischemia.
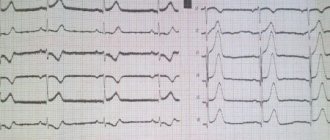
The photo shows an ECG of a patient who has been taking one of the potent heart medications for a long time. There is a noticeable decrease and trough-shaped shape of the ST segment.
It is difficult for a patient who does not have special medical knowledge to understand the results of an electrocardiogram. Sometimes it is necessary to prescribe additional research methods. The ECG interpretation must be shown to the attending cardiologist; only he will be able to make an accurate diagnosis.
Source: https://SamMedic.ru/338079a-chto-oznachaet-depressiya-st-segmenta-v-rasshifrovke-elektrokardiogrammyi
Where does this information apply?
Knowing the norm of st segment elevation on an ECG helps in diagnosing some serious cardiac pathologies: myocardial infarction, coronary heart disease, myocardial hypertrophy, LV aneurysm, pericarditis, myocarditis, PE, etc.
Thus, during heart attacks there is no decrease in the st segment. This indicator can increase to 2-3 mm when the norm is up to 1. In addition to the growth of the CT segment, a pathological Q wave may appear on the electrocardiogram picture.
It is effective to use a troponin test when a heart attack is suspected. When a significant displacement of the CT segment occurs, the latest analysis allows us to clarify the diagnosis. If the test is negative, the patient has not had a heart attack, and acute ischemic disease requires treatment.
Hospital treatment and complications
Upon admission to the hospital with a suspicion of “acute myocardial infarction”, immediate connection to a cardiac monitor is necessary for constant monitoring of the work of the heart muscle and timely administration of drugs. The basis of treatment is to restore vascular patency. In case of poor patency, special drugs are prescribed aimed at: preventing thrombus formation (Aspirin, Plavix, Prausgrel), reducing blood clotting parameters (Heparin, Lovenox, Bivalirudin), resolving existing blood clots ( "Streptokinase", "Apteplase"). Painkillers and beta blockers (Metoprolol, Atenolol), as well as drugs that normalize heart rhythm and support the functioning of other internal organs are needed. Treatment is prescribed in combination under the close supervision of a specialist.
Immediately after diagnosing myocardial infarction, the patient is prescribed therapy to restore the patency of the infarction-associated coronary artery
In case of complete obstruction of the arteries and the patient’s serious condition, surgery is recommended. Coronary artery angioplasty and coronary artery bypass grafting are used. Surgical intervention does not negate drug therapy, but acts as an important addition.
Myocardial infarction with or without st segment elevation can cause complications in the patient:
- development of aneurysm;
- myocardial rupture;
- increased risk of relapse;
- chronic circulatory failure;
- development of ventricular fibrillation;
- development of atrial fibrillation;

When agitation develops, the patient is given tranquilizers that relieve the nervousness after eliminating the pain syndrome
- cardiogenic shock;
- acute heart failure;
- Dressler's syndrome (inflammation of the heart sac).
Therefore, it is important to carry out special treatment in a hospital setting and thoroughly follow the doctor’s recommendations throughout the entire rehabilitation period, which lasts up to one year.
Recommendations for interpreting electrocardiograms
To correctly establish a diagnosis and prescribe effective treatment, it is important for a cardiologist to carefully read the electrocardiogram. There are some rules, taking into account which you can help the patient efficiently.
How he reads the ECG and what treatment he chooses depends on the experience of the cardiologist.
First of all, the ability of the heart to conduct electrical impulses is analyzed. The frequency and rhythm of the pulse are calculated, and the regularity of heart contractions is assessed. The cardiologist then pays attention to the work of the pacemaker and determines how well the impulses travel along the conduction pathways of the heart.
After these studies, the cardiologist evaluates the position of the electrical axis and examines the rotation of the heart around the longitudinal, transverse and anteroposterior axis. At the same stage, the P wave is assessed.
The next stage of deciphering the electrocardiogram is to consider the state of the QRS-T complex. When assessing the ST segment, the J point (the moment the S wave transitions to the ST segment) is important.
The shape of the arc that the J point forms to the end of the ST segment determines the presence of pathology. If it is concave, then the deviation is benign. Convex is a sign of myocardial ischemia.
Multiple ECG Lead Method
A. Right ventricular hypertrophy. Deviation of the electrical axis of the heart to the right; R/S1 in V1 and/or R/S1 in V6. Depending on the shape of the QRS complex in lead V1, there are three types of right ventricular hypertrophy.
1) Type A. High R in lead V1(qR, R, rSR'), often with oblique ST segment depression and negative T wave. Right ventricular hypertrophy, usually pronounced (with pulmonary stenosis, pulmonary hypertension, Eisenmenger syndrome ).
2) Type B. Complex type RS or Rsr' in lead V1; observed with atrial septal defect, mitral stenosis.
3) Type C. Complex type rS or rSr' with a deep S wave in the left precordial leads (V5, V6). Most often - with COPD.
4. Complexes with varying amplitude: electrical alternation. Alternation of the QRS complex: alternation of complexes of different directions and amplitudes. Observed with exudative pericarditis, myocardial ischemia, dilated cardiomyopathy and other organic lesions of the heart. Complete alternation: alternation of the P wave, QRS complex and T wave. Usually observed with exudative pericarditis, often against the background of cardiac tamponade.
E. Q wave
1. Myocardial infarction. Width{amp}gt; 0.04 s ({amp}gt; 0.05 s in lead III). Amplitude {amp}gt; 2 mm or 25% of the amplitude of the R wave (50% in lead aVL, 15% in leads V4—V6).
2. Pseudo-infarction curve. Pathological Q wave in the absence of myocardial infarction. Causes: organic heart lesions (especially dilated cardiomyopathy and hypertrophic cardiomyopathy, amyloidosis, myocarditis), diseases of the musculoskeletal system, hypertrophy of the left or right ventricle, COPD, cor pulmonale, pulmonary embolism, pneumothorax, left bundle branch block, blockade of the anterior branch of the left leg His bundle, WPW syndrome, central nervous system diseases, hypercalcemia, shock, hypoxia, pancreatitis, surgery, cardiac injury.
G. R wave
1. Shift of the transition zone to the right. R/S{amp}gt; 1 in lead V1 or V2. Occurs normally, with right ventricular hypertrophy, posterior myocardial infarction, Duchenne myopathy, right bundle branch block, WPW syndrome.
2. Shift of the transition zone to the left. The transition zone is shifted to V5 or V6. R/S {amp}lt; 1 in leads V5, V6. Occurs normally, with anteroseptal and anterior myocardial infarction, dilated cardiomyopathy and hypertrophic cardiomyopathy, left ventricular hypertrophy, COPD, cor pulmonale, right ventricular hypertrophy, blockade of the anterior branch of the left bundle branch, WPW syndrome.
A. II, III, aVF - posterior accessory tract;
b. I, aVL - left lateral path;
V. V1 with deviation of the electrical axis of the heart to the right - right anterior septal path;
d. V1 with deviation of the electrical axis of the heart to the left - right lateral path.
4. Notch on the descending limb of the R wave (Osborne wave). Late positive wave in the terminal part of the ventricular complex. Observed during hypothermia (treatment - see Chapter 8, paragraph IX.E). As body temperature decreases, the amplitude of the Osborne wave increases.
H. ST segment
The multiple-lead ECG method (computer electrocardiotopography, ECTG) is a method of recording an electrocardiogram sequentially or simultaneously from multiple electrodes from the surface of the chest, back, and abdomen.
Allows you to study the processes of repolarization and depolarization of parts of the heart that are invisible in the 12-lead system, expanding the possibilities for diagnosing heart pathology.
Cardiotopography methods used both in our country and in other countries are very different depending on the capabilities of the devices and multi-electrode belts, including from 35 to 260 or more electrodes. The most widely used method in the Republic of Belarus is the method with 60 electrodes ECTG-60, developed at the Republican Scientific and Practical Center "Cardiology".
Causes of cardiac changes
Myocardial infarction and other serious cardiovascular pathologies do not develop overnight. Perhaps the person neglected the alarming symptoms for some time, or did not follow the recommendations of the attending physician. Some did not take such a diagnosis as coronary artery disease seriously, underestimating the risks of the pathology.
Abnormalities in electrocardiogram results may appear for various reasons. Most often, this study provides a reliable picture of the work of the heart muscle. Although errors do occur, they are very rare.
Important! ST segment depression symptoms sometimes appear even in healthy people. If, in addition to changes in the ECG, there are no negative symptoms, we can talk about the physiological norm. Although periodic visits to a cardiologist and monitoring of heart condition should not be neglected.
Deviations from the norm in the electrocardiogram picture may appear if the procedure is performed incorrectly. This situation is possible if the electrodes are applied incorrectly. In this case, there is not enough contact, and the device records unreliable data.
Other non-cardiac causes of ECG abnormalities:
- electrolyte disturbances;
- hyperventilation;
- abuse of medications, including narcotic drugs;
- frequent drinking of alcohol;
- drinking cold water.
The development of any pathology can be stopped subject to timely diagnosis and proper treatment. To do this, if the slightest unpleasant symptoms appear in the heart area, it is recommended to visit a therapist to get a referral for examination. This way you can prevent the development of serious and dangerous pathologies.
lechiserdce.ru
Causes and symptoms
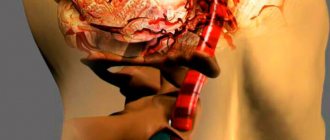
Vascular atherosclerosis and coronary artery disease lead to increased thrombus formation inside the coronary arteries. When a vessel is completely blocked, the heart muscle, the myocardium, begins to work at an accelerated pace, and a heart attack occurs. The condition is extremely dangerous immediately after the first symptoms appear. Without timely first aid, the risk of death is high. The essence of a heart attack is the appearance of an area of necrosis of cardiac cells. In this case, the myocardium loses its properties and turns into a piece of connective tissue, the heart wall becomes thin, and the cavity of the left ventricle increases, its contractions decrease, and the heart stops working properly.

Myocardial infarction is the sudden death of tissue in the heart wall, which leads to scar formation and subsequent reduced functionality
Symptoms of a heart attack include:
- severe chest pain radiating to the shoulder, back or neck;
- severe nausea and abdominal pain;
- state of tachycardia;
- shortness of breath accompanied by respiratory arrest;
- pale skin;
- excessive sweating;
- loss of consciousness.
If more than one symptom is detected in a patient, an ambulance should be called immediately. Refusal to hospitalize is unacceptable. All the causes of heart attack have not yet been studied. Doctors identify the main factors that provoke the development of the disease: lack of physical activity, excess weight, unbalanced diet with a predominance of fats and preservatives, stress, bad habits, excessive caffeine consumption, high physical activity, old age, hypertension, atherosclerosis, genetics.
Myocardial infarction is also diagnosed among the young population. Moreover, a large proportion of all cases of the disease occur in men. More than 50% of cases end in death or the development of serious complications.

Among the causes of heart attack, experts include such a dangerous manifestation as acute myocardial ischemia, which occurs due to rupture or splitting of an atherosclerotic plaque