P wave on ECG
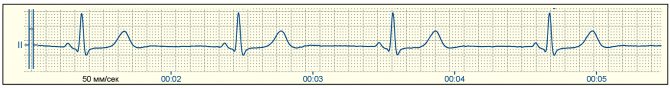
Rhythmogram of lead II with normal P waves. The P wave displays the process of atrial depolarization.
It is the key to determining the heart rhythm, so it is very important to learn how to find it on an ECG. If the heart rhythm is sinus, as it should be normally, then the P wave should meet the following criteria:
- It is always positive in leads II and aVF.
- It is always negative in lead aVR
Besides:
- The duration (width) of the P wave is no more than 0.1-0.12 s.
- The amplitude (height) of the P wave is 1.5-2.5 mm
Where and how to look for the P wave on an ECG
It is best to look for it in leads II or V1. First, find an isoline, which is a relatively long section of the ECG without waves (straight line) . Normally, the first wave appearing after the isoline will be the P wave.
Rhythmogram of lead II with normal P waves
What can the P wave be confused with?
In theory, everything seems simple. But there are several conditions in which the P wave can be confused with something else. Let's look at the main problem situations.
You see P waves, but their polarity is not what it should be normally.
Junctional rhythm
The P wave should be positive in leads II, aVF, but on the ECG above it is negative. This is not sinus P, it is a junctional rhythm (a type of supraventricular rhythm). You can read more about this rhythm disorder in the corresponding section of the site.
You see two, three or more P-shaped teeth following each other.
Atrial flutter
If you see a similar phenomenon, then you need to think that these waves are not P waves, since this is a whole wave and it has a special name - F waves. This is atrial flutter.
There may be another situation here, for example, AV block, when there are normal P waves following one after another, since not each of them is conducted through the AV node.
You see what looks like P waves, but they are very fuzzy and don't look alike
Look at this ECG. It seems like there are some waves here and there that could pass for a P wave, doesn't it?
Slurred P waves*
But if you can't find two identical waves at the same distance from the ventricular complex in consecutive cardiac cycles (QRST), then they are not P waves! And if the heart rate is not rhythmic, as in the above ECG, then you should immediately think about atrial fibrillation (atrial fibrillation). It is this rhythm disturbance that is represented on this tape.
In general, we have analyzed the most common problems encountered when searching and identifying P waves on an ECG. But the more you work with the ECG, the faster you will see that the problem with the P wave remains relevant even for experienced specialists. Sometimes, just from one ECG tape it is not possible to understand what we are dealing with. But no matter what, you still need to start your journey with simple things that we talked about earlier.
If you want to practice a little, and not only on the topic of the P wave, then there are more than 100 ECG tasks at your disposal in the form of tests. The link is located in the main menu of the site.
If you find any error, please select a piece of text and press “ Ctrl+Enter”
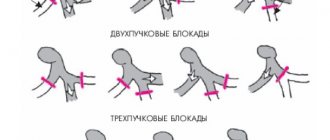
Intraventricular conduction disorders
Source: https://sinref.ru/000_uchebniki/03200medecina/954_ritmy-serdca-narusheniya/032.htm
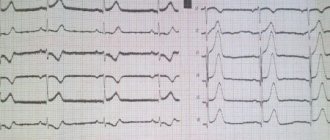
| In healthy people of people , more often in young people and especially in children, on the ECG in the right precordial leads (V1, V3R, V2) a second r wave (denoted r) of small amplitude and width is often observed - type rSrvl or splitting on the ascending knee of the SV1 wave. This small tooth is associated with the excitation of the “supraventricular ridge”, which is still hypertrophied in the fetus, located in the region of the conus pulmonale of the right ventricle. This area is the last to be excited, so its hypertrophy causes an increase in EMF at the end of the QRS period. Scallop hypertrophy develops in the fetus and is not associated with hemodynamic pathology after birth. In this regard, people with a hypertrophied “supraventricular crest” should be considered healthy. Presence of a small tooth r'v1 , which is usually of smaller amplitude than the rvl wave or equal to it, in the absence of its widening, widened SV6, QRS widening and other ECG changes characteristic of incomplete right bundle branch block, should be regarded as a variant of a normal ECG. We believe that the signs of “supraventricular crest syndrome” should be indicated in the first, descriptive part of the ECG protocol. If the specialist analyzing the ECG If I am convinced that these signs are not associated with hypertrophy of the right ventricle or “incomplete” (“partial”) blockade of the right branch of the His bundle (see the corresponding chapters), then this syndrome should not be mentioned in conclusion, since it is not associated with pathology. ECG healthy man K., 27 years old. The sinus rhythm is regular, 63 per minute. Interval P - Q = 0.17 sec. P=0.08 sec. QRS=0.08 sec. Q - T=0.36 sec. RII>RIII>RI. AQRS=+80°. At=+49°. Angle QRS—T=31°. AR=+43°. The PI,II,V2-V6 wave is positive. PIII,V1 two-phase (+-) with a main positive phase. QRSIII complex type qR. QRSII,V4V6 type qRS. QRSV1 complex, rS type with pronounced cleavage on the ascending limb of the S wave. The cleavage tooth reaches the level of the isoelectric line. The T wave and RS-T segment are normal in all leads. Conclusion . Variant of a normal ECG. Vertical position of the electrical axis of the heart. Presented ECGs do not exhaust the entire set of options for a normal ECG, but are the main ones. The demonstrated analysis of these ECGs will allow the physician to understand other variations of a normal ECG. |
What is a cardiogram?
The cardiogram graphically shows the electrical processes occurring in the heart muscle, or more precisely, the excitation (depolarization) and restoration (repolarization) of muscle tissue cells.
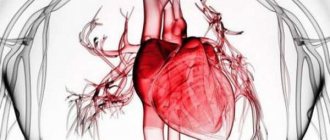
The impulse is carried out through the conduction system of the heart - a complex neuromuscular structure consisting of the sinoatrial, atrioventricular nodes, legs and bundles of His, turning into Purkinje fibers (their location is shown in the figure). The cardiac cycle begins with the transmission of an impulse from the sinoatrial node, or pacemaker. It sends a signal 60–80 times per minute, equal to the normal heart rate in a healthy person, to the atrioventricular node.
In case of pathologies of the sinoatrial node, the main role is played by the AV node, whose pulse frequency is approximately 40 per minute, which causes bradycardia. Next, the signal passes into the His bundle, consisting of the trunk, right and left legs, which, in turn, pass into the Purkinje fibers.
The conduction system of the heart ensures the automaticity and correct sequence of contractions of all parts of the heart. Pathologies of the conduction system are called blockades.
Using an ECG, you can identify many indicators and pathologies, such as:
A segment is a part of an isoline located between two teeth. Isoline is a straight line on a cardiogram. Interval - a tooth together with a segment.
As can be seen from the figure below, the ECG consists of the following elements:
- Wave P - reflects the spread of the impulse through the right and left atrium.
- PQ interval is the time it takes for an impulse to travel to the ventricles.
- The QRS complex is the excitation of the ventricular myocardium.
- The ST segment is the time of complete depolarization of both ventricles.
- The T wave is ventricular repolarization.
- QT interval – ventricular systole.
- The TR segment reflects the diastole of the heart.
ECG interpretation
Leads are an integral part of the analysis. Leads are the potential difference between points that are needed for a more accurate diagnosis. There are several types of leads:
- Standard leads (I, II, III). I – potential difference between the left and right hand, II – right hand and left leg, III – left hand and left leg.
- Reinforced leads. A positive electrode is placed on one of the limbs, while negative electrodes are placed on the remaining two (there is always a black electrode on the right leg - grounding).
There are three types of enhanced leads - AVR, AVL, AVF - from the right arm, left arm and left leg, respectively.
- Chest leads:
Decoding ECG - numbers and Latin letters
A full-scale interpretation of the cardiac cardiogram includes an assessment of the heart rhythm, the functioning of the conduction system and the condition of the myocardium. For this, the following leads are used (electrodes are installed in a certain order on the chest and limbs):
- Standard: I - left/right wrist on the hands, II - right wrist and ankle area on the left leg, III - left ankle and wrist.
- Strengthened: aVR - right wrist and combined left upper/lower limbs, aVL - left wrist and combined left ankle and right wrist, aVF - left ankle area and combined potential of both wrists.
- Thoracic (potential difference between the electrode with a suction cup located on the chest and the combined potentials of all extremities): V1 - electrode in the IV intercostal space along the right border of the sternum, V2 - in the IV intercostal space to the left of the sternum, V3 - on the IV rib along the left parasternal line, V4 - V intercostal space along the left midclavicular line, V5 - V intercostal space along the anterior axillary line on the left, V6 - V intercostal space along the mid-axillary line on the left.
Additional pectorals - located symmetrically to the left pectoral with additional V7-9.
One cardiac cycle on the ECG is represented by the PQRST graph, which records electrical impulses in the heart:
- P wave - displays atrial excitation;
- QRS complex: Q wave - the initial phase of depolarization (excitation) of the ventricles, R wave - the actual process of ventricular excitation, S wave - the end of the depolarization process;
- T wave - characterizes the extinction of electrical impulses in the ventricles;
- ST segment - describes the complete restoration of the original state of the myocardium.
When deciphering ECG indicators, the height of the teeth and their location relative to the isoline, as well as the width of the intervals between them, are important.
Sometimes a U pulse is recorded behind the T wave, indicating the parameters of the electrical charge carried away with the blood.
T wave value
T waves correspond to the onset of repolarization after muscular excitation of the ventricles (contraction), which corresponds to the return of sodium and potassium ions across the cell membranes in preparation for the next depolarization. The T wave originates from the isoline (from the end of the ST segment). Its normal values correspond to:
- non-jagged (smooth) and positive indicators (above the isoline);
- flatness at the initial stage;
- coincidence of the direction of the electrical axis with the QRS complex (normally, sixty-degree deviations are allowed), that is, the predominance of R corresponds to the positive direction of the T wave, and the dominance of S – to the negative;
- an increase in the amplitude of the T wave in the chest leads from the first to the third (acceptable size is from three to eight cells along the axis), while negative polarity is atypical for this gap;
- the possibility of negative polarity and smoothness in V1 and the obligatory nature of negative value in AVR;
- mandatory positivity in I and II, possible positivity in AVL and AVF (the schedule can be smoothed or two-phase);
- permissible negativity in AVL and mandatory - in lead III;
- higher levels in lead I compared to lead III;
- higher levels in lead V6 compared to lead V1.
Thus, a change in the T wave on the ECG indicates a violation of the restorative function of the cardiac ventricles after contraction. But it can also be influenced by other factors. The true causes of such cardiac dysfunction can be determined by the amplitude, size (along the axis) and polarity of the T wave.