Myocardial infarction on ECG
Myocardial infarction on the ECG has a number of characteristic signs that help differentiate it from other disorders of conduction and excitability of the heart muscle. It is very important to conduct an ECG diagnosis in the first few hours after an attack in order to obtain data on the depth of the lesion, the degree of functional heart failure, and the possible localization of the lesion. Therefore, if possible, the cardiogram is taken while still in the ambulance, and if this is not possible, then immediately upon the patient’s arrival at the hospital.
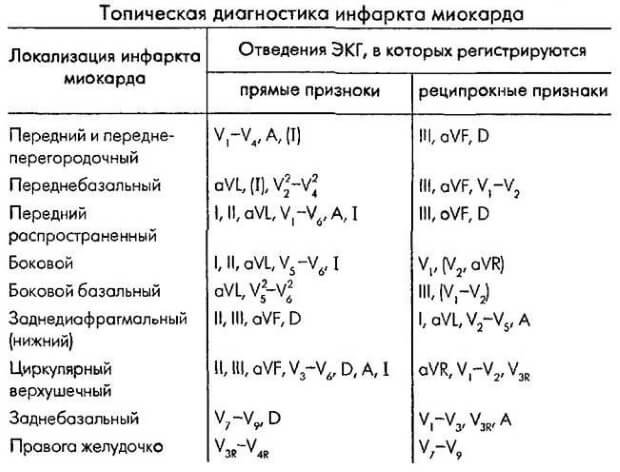
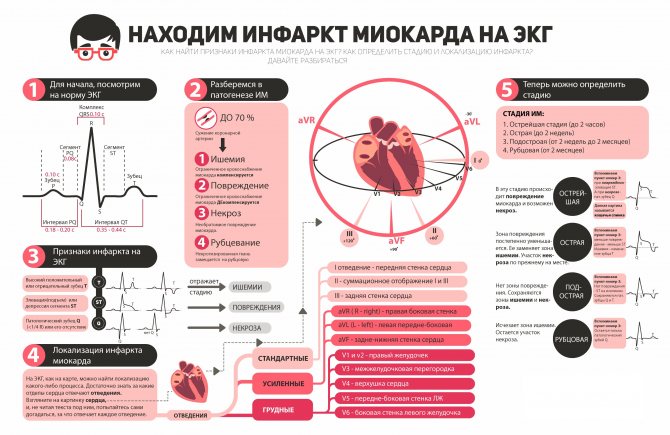
Localization of ischemic foci on the ECG
ECG diagnostics allows you to determine the location of the ischemic focus.
For example, it may appear in the walls of the left ventricle, on the anterior walls, septa or lateral walls. It is least common in the right ventricle, so specialists use chest leads to determine it in diagnosis.
Localization of infarction by ECG:
- Anterior – the LAP artery is affected. Indicators: V1-V4. Leads: II, III, aVF.
- Posterior – the RCA artery is affected. Indicators: II, III, aVF. Leads: I, aVF.
- Lateral – the Circunflex artery is affected. Indicators: I, aVL, V5. Leads: VI.
- Basal – the RCA artery is affected. Indicators: none. Leads V1,V2.
- Septal – the Septal performan artery is affected. Indicators: V1,V2, QS. Leads: none.
ECG signs of myocardial infarction
An electrocardiogram reflects the electrical activity of the heart - by interpreting the data from such a study, one can obtain comprehensive information about the functioning of the conduction system of the heart, its ability to contract, pathological foci of excitation, as well as the course of various diseases.
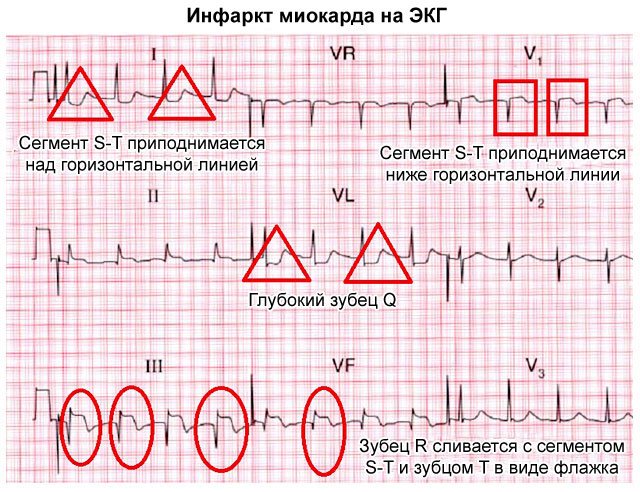
The first sign to look for is deformation of the QRST complex, in particular, a significant reduction in the R wave or its complete absence.
The classic ECG picture consists of several areas that can be seen on any normal tape. Each of them is responsible for a separate process in the heart.
- P wave – visualization of atrial contraction. By its height and shape one can judge the state of the atria, their coordinated work with other parts of the heart.
- PQ interval - shows the spread of the excitation impulse from the atria to the ventricles, from the sinus node down to the atrioventricular node. Prolongation of this interval indicates a conduction disorder.
- The QRST complex is a ventricular complex that provides complete information about the state of the most important chambers of the heart, the ventricles. Analysis and description of this part of the ECG is the most important part of diagnosing a heart attack; the main data is obtained from here.
- The ST segment is an important part, which is normally an isoline (a straight horizontal line on the main axis of the ECG that does not have teeth), and in pathologies it can fall and rise. This may be evidence of myocardial ischemia, i.e. insufficient blood supply to the heart muscle.
Any changes in the cardiogram and deviations from the norm are associated with pathological processes in the cardiac tissue. In the case of a heart attack - with necrosis, that is, necrosis of myocardial cells with their subsequent replacement with connective tissue. The stronger and deeper the damage, the wider the area of necrosis, the more noticeable the changes on the ECG will be.
The first sign to look for is deformation of the QRST complex, in particular, a significant reduction in the R wave or its complete absence. This indicates a violation of ventricular depolarization (the electrical process responsible for heart contraction).
Any changes in the cardiogram and deviations from the norm are associated with pathological processes in the cardiac tissue. In the case of a heart attack - with the necrosis of myocardial cells, followed by their replacement with connective tissue.
Further changes affect the Q wave - it becomes pathologically deep, which indicates a disruption in the functioning of pacemakers - nodes made of special cells in the thickness of the myocardium that begin contraction of the ventricles.
The ST segment also changes - normally it is on the isoline, but during a heart attack it can rise higher or fall lower. In this case, they speak of elevation or depression of the segment, which is a sign of ischemia of the heart tissue. Using this parameter, it is possible to determine the localization of the area of ischemic damage - the segment is raised in those parts of the heart where necrosis is most pronounced, and lowered in the opposite leads.
Also, after some time, especially closer to the scarring stage, a negative deep T wave is observed. This wave reflects massive necrosis of the heart muscle and makes it possible to determine the depth of damage.
An ECG photo for myocardial infarction with interpretation allows you to consider the described signs in detail.
The tape can move at speeds of 50 and 25 mm per second; lower speeds with better detail have greater diagnostic value. When diagnosing a heart attack, not only changes in leads I, II and III are taken into account, but also in the reinforced ones. If the device allows you to record the chest leads, then V1 and V2 will display information from the right parts of the heart - the right ventricle and atrium, as well as the apex, V3 and V4 about the apex of the heart, and V5 and V6 will indicate the pathology of the left parts.
Closer to the scarring stage, a negative deep T wave is observed. This wave reflects massive necrosis of the heart muscle and allows you to determine the depth of damage.
With different locations of infarction
The location of the ischemic zone is another factor that influences the ECG signs of myocardial infarction.
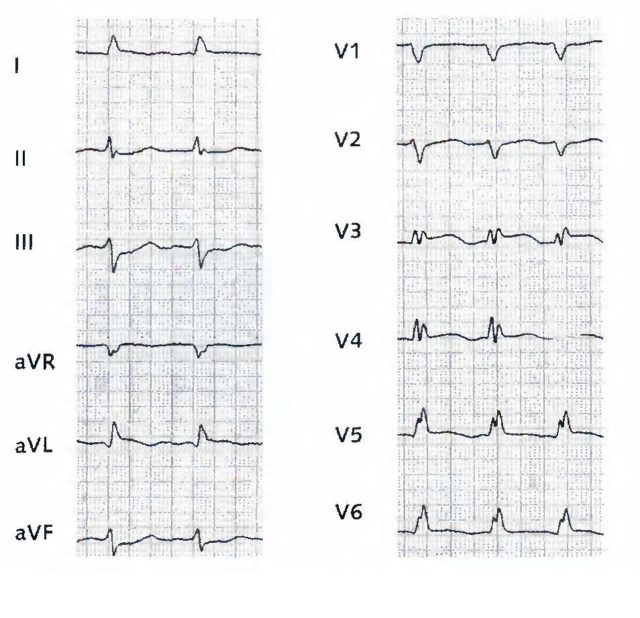
Decoding of myocardial infarction on the ECG is carried out in 12 leads, each of which is responsible for the corresponding section of the heart muscle.
Standard leads:
- I — displays information about changes localized in the anterior and lateral parts of the left ventricle;
- III - allows you to assess the condition of the posterior part of the diaphragmatic surface of the heart;
- Lead II is used to confirm the data obtained when assessing leads I or III.
Important information: Pre-infarction symptoms and first signs of a heart attack in men
Reinforced leads:
- aVL (amplified from the left hand) - allows you to evaluate changes in the lateral wall of the left ventricle;
- aVF (intensified from the right leg) - posterior part of the diaphragmatic surface;
- aVR (amplified from the right hand) - is considered uninformative, but can be used to assess infarct changes in the interventricular septum and inferolateral parts of the left ventricle.
Chest leads:
- V1, V2 - changes in the interventricular septum;
- V3 - anterior wall;
- V4 - apical localization of infarction;
- V5, V6 - lateral part of the left ventricle.
Anterior or anteroseptal
With such localization of the lesion on the cardiogram, changes are assessed as follows:
- in the I, II standard and aVL leads, a Q wave and an ST segment similar to the T wave are observed;
- in the III standard and aVF leads - the transition of ST to the T-wave located below the line;
- in the 1st, 2nd, 3rd chest, as well as when moving to the 4th chest - absence of R and location of ST above the line by 0.2-0.3 cm or more;
- leads aVR and 4,5,6 chest will show the following changes: the T wave is flattened, ST is shifted down.
Side
An ECG during a heart attack with lateral localization is accompanied by widening and deepening of the Q-wave, an increase in ST and the connection of this segment with the T-wave. These signs are observed in standard III, 5,6 chest and aVF leads.
Anteroposterior or combined
The combined Q-infarction is assessed in leads: I, III, aVL, aVF, 3, 4, 5, chest. On an ECG, a heart attack looks like this:
- Q is widened and deepened;
- the ST segment rises strongly above the line;
- positive T connects to ST.
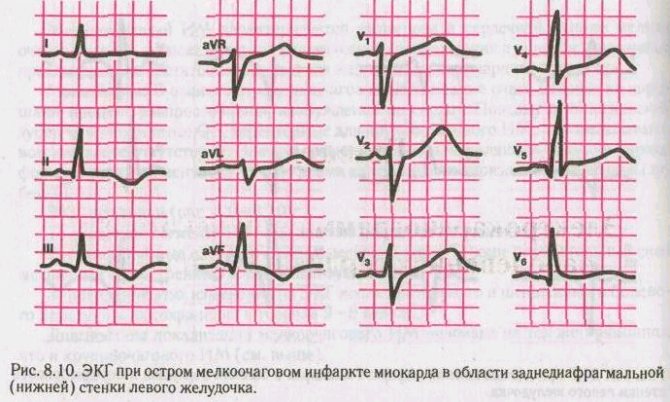
Posterior or diaphragmatic
A heart attack on the ECG with diaphragmatic localization has the following signs:
- II, III and aVF leads: wide Q, positive T, connected to high ST;
- Lead I: dropped below the ST line;
- in some cases, changes in the T wave in the form of negative deformation and a decrease in ST are visible in all chest leads.
Important information: The first symptoms of pulmonary infarction and how to treat infarction pneumonia
Interventricular septum
Damage to the interventricular septum by infarction on the ECG is manifested by deepening of Q, elevation of T and ST in leads that transmit information about the state of the anterior part of the septum (I, aVL, 1,2 thoracic). With ischemia in the posterior part of the septum (thoracic leads 1 and 2), the following are visible: an enlarged R wave, atrioventricular block of varying degrees and a slight displacement below the ST segment isoline.
Anterior subendocardial
This type of heart attack is characterized by changes on the ECG:
- in I, aVL and 1-4 chest leads - the T wave is positive, its height is greater than that of R;
- II, III standard - smooth decrease in ST, negative location of the T wave, low R;
- 5th and 6th chest - division of T into negative and positive parts.
Posterior subendocardial
With posterior subendocardial localization, signs of myocardial infarction on the ECG in chest leads II, III, aVF and 5, 6: the R wave decreases, T becomes positive, and later ST begins to descend.
Right ventricular infarction
Because The right and left ventricles have a common source of blood supply (coronary arteries); with a heart attack in the right half, changes also occur in the anterior part of the left ventricle.
Diagnostics using electrodes rarely allows effective recognition of right ventricular infarction, even with the use of additional electrodes. With this type of cardiac circulatory disorder, ultrasonography is preferable to ECG indicators.
Despite the informative nature of the method, the cardiogram is not the only test whose data should be relied upon when diagnosing a heart attack. Along with changes in the cardiographic curve, clinical symptoms and indicators of the level of cardiac-specific enzymes are taken into account: MB-CPK, CPK, LDH, etc. Only the presence of 2 or more signs provides a basis for making a diagnosis with accuracy.
Stages of myocardial infarction on ECG
A heart attack occurs in several stages, and each period is marked by special changes on the ECG.
- The ischemic stage (damage stage, acute) is associated with the development of acute circulatory failure in the tissues of the heart. This stage does not last long, so it is rarely recorded on a cardiogram tape, but its diagnostic value is quite high. At the same time, the T wave increases and becomes sharper - they speak of a giant coronary T wave, which is a harbinger of a heart attack. Then ST rises above the isoline; its position here is stable, but further elevation is possible. When this phase lasts longer and becomes acute, a decrease in the T wave can be observed, as the focus of necrosis spreads to the deeper layers of the heart. Reciprocal and reverse changes are possible.
- The acute stage (necrosis stage) occurs 2-3 hours after the onset of the attack and lasts up to several days. On the ECG it looks like a deformed, wide QRS complex, forming a monophasic curve, where it is almost impossible to distinguish individual waves. The deeper the Q wave on the ECG, the deeper layers were affected by ischemia. At this stage, a transmural infarction can be recognized, which will be discussed later. Characteristic rhythm disturbances are arrhythmias, extrasystoles.
- The onset of the subacute stage can be recognized by stabilization of the ST segment. When it returns to the baseline, the infarction no longer progresses due to ischemia, and the recovery process begins. The greatest importance in this period is the comparison of the existing T wave sizes with the original ones. It can be either positive or negative, but will slowly return to the baseline in sync with the healing process. Secondary deepening of the T wave in the subacute stage indicates inflammation around the necrosis zone and does not last long, with proper drug therapy.
- In the scarring stage , the R wave rises again to its characteristic values, and T is already on the isoline. In general, the electrical activity of the heart is weakened, because some of the cardiomyocytes have died and been replaced by connective tissue, which does not have the ability to conduct and contract. Pathological Q, if present, is normalized. This stage lasts up to several months, sometimes six months.
It is very important to conduct an ECG diagnosis in the first few hours after an attack in order to obtain data on the depth of the lesion, the degree of functional heart failure, and the possible localization of the lesion.
Myocardial infarction: general principles of ECG diagnosis.
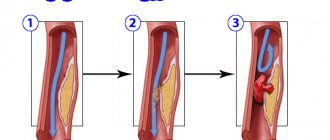
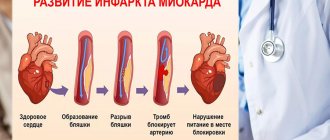
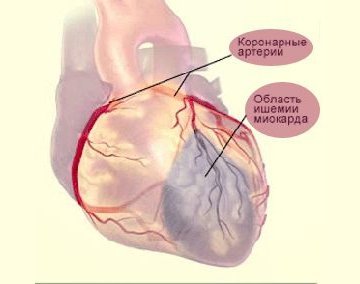
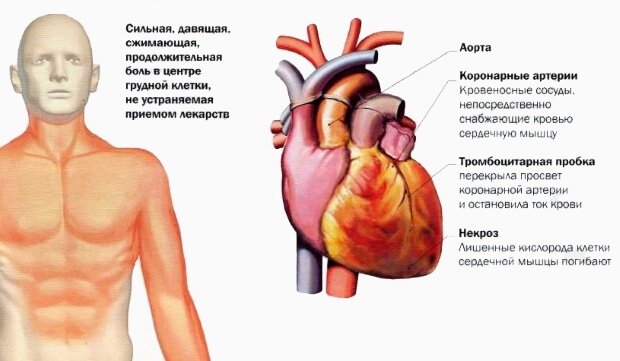
During infarction (necrosis), muscle fibers die. Necrosis is usually caused by thrombosis of the coronary arteries or their prolonged spasm, or stenosing coronary sclerosis. The necrosis zone is not excited and does not generate EMF. The necrotic area, as it were, breaks through a window into the heart, and with transmural (full depth) necrosis, the intracavitary potential of the heart penetrates into the subepicardial zone.
In the vast majority of cases, the arteries supplying the left ventricle are affected, and therefore heart attacks occur in the left ventricle. Right ventricular infarction occurs much less frequently (less than 1% of cases).
An electrocardiogram allows not only to diagnose myocardial infarction (necrosis), but also to determine its location, size, depth of necrosis, stage of the process and some complications.
With a sharp disruption of coronary blood flow, 3 processes sequentially develop in the heart muscle: hypoxia (ischemia), damage and, finally, necrosis (infarction). The duration of the pre-infarction phases depends on many reasons: the degree and speed of blood flow disturbance, the development of collaterals, etc., but usually they last from several tens of minutes to several hours.
The processes of ischemia and damage are outlined in the previous pages of the manual. The development of necrosis affects the QRS segment of the electrocardiogram.
Above the area of necrosis, the active electrode registers a pathological Q wave (QS).
Let us recall that in a healthy person, in the leads reflecting the potential of the left ventricle (V5-6, I, aVL), a physiological q wave can be recorded, reflecting the excitation vector of the heart septum. The physiological q wave in any leads except aVR should not be more than 1/4 of the R wave with which it was recorded, and longer than 0.03 s.
When transmural necrosis occurs in the heart muscle above the subepicardial projection of necrosis, the intracavitary potential of the left ventricle is recorded, which has the formula QS, i.e.
represented by one large negative tooth. If, along with necrosis, there are also functioning myocardial fibers, then the ventricular complex has the formula Qr or QR, and the larger this functioning layer, the higher the R wave. The Q wave in the case of necrosis has the properties of a necrosis wave: more than 1/4 of the R wave amplitude and duration of 0.03 s.
The exception is lead aVR, in which the intracavitary potential is normally recorded, and therefore the ECG in this lead has the formula QS, Qr or rS.
Another rule: Q waves that are bifurcated or jagged are most often pathological and reflect necrosis (myocardial infarction).
Look at the animations of the formation of an electrocardiogram during three sequential processes: ischemia, damage and necrosis
Ischemia:
Damage:
Necrosis:
So, the main question for diagnosing myocardial necrosis (infarction) has been answered: with transmural necrosis, the electrocardiogram in the leads that are located above the necrosis zone has the formula of the gastric complex QS; with non-transmural necrosis, the ventricular complex has the appearance of Qr or QR.
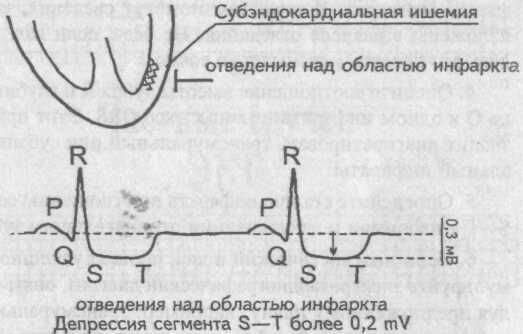
Another important pattern is characteristic of a heart attack: in the leads located in the zone opposite to the focus of necrosis, mirror (reciprocal, discordant) changes are recorded - the Q wave corresponds to the R wave, and the r(R) wave corresponds to the s(S) wave. If the ST segment is raised upward by an arc above the infarction zone, then in the opposite areas it is lowered by an arc downwards (See figure).
Localization of infarction.
An electrocardiogram allows you to distinguish between infarction of the posterior wall of the left ventricle, septum, anterior wall, lateral wall, and basal wall of the left ventricle.
To diagnose right ventricular infarction, which accounts for less than 1% of all infarctions, special right chest leads are used.
Below is a table for diagnosing different localizations of myocardial infarction using 12 leads included in the standard electrocardiographic study.
| Localization heart attack | Amazed artery | Indicative leads | Reciprocal leads |
| Front | LAP | V1 - V4 | II, III, aVF |
| Rear | RCA | II, III, aVF | I, aVL |
| Side | Circumflex | I, aVL, V5, V6 | V1 |
| Septal | Septal perforat. | V1-2,or V3: QS | No. |
| Basal | RCA | No. | V1, V2 |
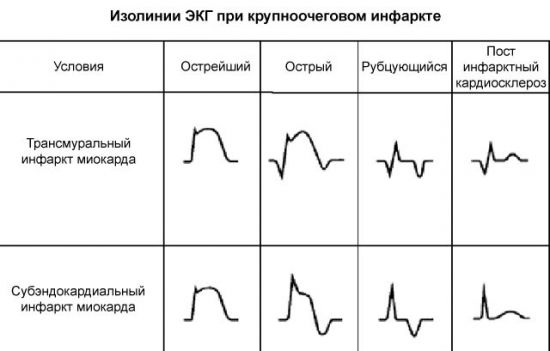
Electrocardiographic stages of myocardial infarction.
According to the electrocardiogram, 4 main stages of the course of a heart attack are distinguished.
1. The most acute stage. Covers the time from onset to development of cardiac muscle necrosis. It lasts from several tens of minutes to several hours. Manifested by electrocardiographic syndromes of ischemia and damage. (under number 1 in the figure).
2. Acute stage. Covers the period from the development of necrosis to relative stabilization, reduction of the ischemic area and damage. This stage lasts from several days to 2-3 weeks. The electrocardiogram combines 2 syndromes - necrosis and damage. As a rule, there is a pathological Q wave (QS), ST above the isoline with an arc upward (in reciprocal leads below the isoline with an arc downward). Towards the end of this stage, ST approaches the isoline, delimitation of the zone of damage and ischemia begins - the first signs of the formation of a coronary T wave appear (2, 3, 4).
3. Subacute stage. Reparative processes continue, the necrosis zone is delimited, damage is reduced, and a scar begins to form. The pathological Q wave remains on the ECG, but QS can be replaced by Qr or QR complexes. ST on isoline. The ischemic zone is delimited and deep negative isosceles (coronary) T waves are formed (5, 6).
4. Scar stage (cardiosclerosis stage). Lasts from 2-3 to 6-8 months. The pathological Q and ST wave remains on the isoline, the coronary T wave remains, although by the end of this period it begins to decrease in amplitude and becomes unequal. (7, 8).
Traces of a heart attack. The pathological Q wave can persist for the longest time, sometimes for decades. Gradually, it can decrease in amplitude, but its duration exceeds the norm. For some people, after 1-3 years, all traces of a heart attack may disappear.
Clinical picture of the acute form
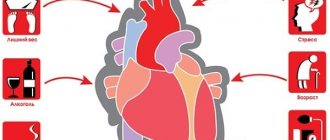
The symptoms that characterize myocardial infarction differ and depend on the form of the disease. Hypertensive crisis, excessive fatigue, severe physical activity or stress are factors that contribute to the manifestation of the disease.
- Pre-infarction state . Occurs only in half of cases of myocardial infarction. Manifests itself in unstable angina, which has a progressive course.
The most acute condition .
The main symptom is pain of varying severity. Its intensity depends on the area of myocardial damage. Pain can be of different types:
The peculiarity of pain during myocardial infarction is that it radiates to the neck, collarbone, left shoulder, ear, lower jaw, teeth or under the scapula . The pain lasts from half an hour to several days and does not stop after taking nitrates.
Atypical forms of heart attack . In elderly patients with signs of atherosclerosis, atypical forms of heart attack may occur. This clinical picture is often observed against the background of repeated myocardial infarction.
Decoding the cardiogram
In making a diagnosis, the correct interpretation of the cardiogram plays an important role, namely, establishing the type of attack and the extent of damage to the cardiac tissue.
Different types of attack
A cardiogram allows you to determine what kind of heart attack is taking place - small-focal and large-focal. In the first case, there are small amounts of damage. They are concentrated directly in the heart area. Complications are:
- cardiac aneurysm and rupture;
- heart failure;
- ventricular fibrillation;
- asystological thromboembolism.
The onset of small focal infarction is not often recorded. Most often it occurs macrofocally. It is characterized by significant and rapid damage to the coronary arteries due to thrombosis or prolonged spasms. As a result, a large area of dead tissue appears.
Acute small focal MI
The localization of the lesion is the basis for dividing the infarction into:
- front;
- rear;
- septal MI;
- lower;
- Side wall MI.
Based on its course, the attack is divided into:
- Repeated heart attack, which occurs 2 months after the first lesion. Pathological processes develop between necrotic tissues. It's going hard.

Recurrent, occurring again during the first month while the patient is still in the hospital. Gradually, during pathological processes, new capture of dying tissue occurs. The pain syndrome is mild, complicating the course of a heart attack.- Continued, during which necrolysis of new areas continuously occurs. The prognosis is unfavorable.
Heart attacks are also classified according to the depth of the lesion, depending on the depth of tissue death.
Prehospital diagnostic measures
Preclinical diagnosis consists of interviewing the patient and identifying symptoms. Features of the development of a heart attack include:
- atypically prolonged pain syndrome;
- lack of effect from taking nitrates;
- no dependence of pain on body position;
- greater intensity of symptoms compared to attacks that occurred earlier and did not end in a heart attack.
Learn about nursing care for myocardial infarction in a separate article - what needs to be done for the patient?
What is cardiac bypass surgery after a heart attack and how is it performed? Find out everything about the operation here.
Inferior infarction and its characteristics
Posterior ventricular infarction is difficult to diagnose using ECG. In medical practice, in about 50% of cases, diagnostics do not show problems with the posterior regions of the ventricle.
The posterior wall of the ventricle is divided into the following parts:
- The diaphragmatic region, where the posterior walls adjacent to the diaphragm are located. Ischemia in this part causes an inferior infarction (posterior phrenic).
- The basal region (upper walls) adjacent to the heart. Cardiac ischemia in this part is called posterobasal infarction.
An inferior infarction occurs as a result of blockage of the right coronary artery. Complications are characterized by damage to the interventricular septum and posterior wall.
With it, the ECG indicators change:
- The third Q wave becomes larger beyond the third R by 3 mm.
- The scar stage is characterized by a decrease in Q to half R (VF).
- The expansion of the third Q wave to 2 mm is diagnosed.
- With a posterior infarction, the second Q wave rises above the first Q (in a healthy person these indicators are the opposite).
The presence of Q in one of the leads does not guarantee a posterior infarction. It can disappear and appear when a person breathes intensely. For diagnosis, an ECG must be performed several times.
Doctor:
Shishkina Olga ✓ Article checked by doctor
Instrumental diagnostics
The main ones in making a diagnosis are instrumental research methods, such as EGC and EchoCG.
Electrocardiography
An ECG is the most common way to detect myocardial infarction, even if it is asymptomatic . The acute stage and the recovery process are characterized by a negative T wave. With a large-focal infarction, a pathological QRS complex or Q wave is detected. Healed myocardial infarction is manifested in a decrease in the amplitude of the R wave and preservation of the Q wave.
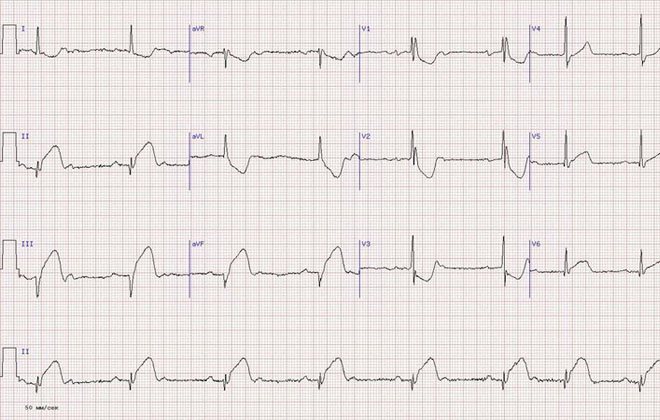
The photo pictures below show options for what changes on the ECG look like during myocardial infarction with interpretation and description, signs by stage (from acute to post-infarction) and localization.
Click on the image above to see it in full.
EchoCG
Echocardiography reveals thinning of the ventricular wall and decreased contractility. The accuracy of the study depends on the quality of the resulting image.
Modern diagnostic methods
Along with electrocardiography, echocardiography can also be mentioned. These methods are used successfully in diagnosing heart function, and also detect the slightest disturbances. What is the difference?
These types of research are distinguished according to the following principles:
- according to the method of conducting the research,
- by the nature of the diseases that are diagnosed as a result,
- in terms of the accuracy of the results and the extensiveness of examinations of the entire cardiovascular system.
Electrocardiography can analyze heart rhythms and also examine electrical impulses within the heart. Echocardiography allows you to examine the ability of blood vessels to supply the heart with blood and oxygen.
If during an ECG, special electrodes are attached to the patient, and graphs are displayed on paper - the so-called results of cardiac work, then EchoCG is more like an ultrasound. A sensor is applied to the left side of the chest, and a three-dimensional image is displayed on the screen, from which the doctor can examine the problem.
Experienced specialists prefer the latter type of diagnosis. EchoCG allows you to most accurately determine the condition of the heart, see past diseases, and identify areas of damage. At the same time, the vessels are examined, and the places where they are blocked are also visible. Thus, it is possible to eliminate a heart attack in a timely manner, preventing it from developing.
Do not underestimate the electrocardiogram. As the oldest method, it is already becoming less informative. However, it can be done at any institution without registration and expectations. An ECG in acute myocardial infarction can reveal the extent of necrosis. The ECG is considered the most informative method in people without apparent cause or pain. The graph clearly shows dangerous conditions for treatment: heart failure, arrhythmia.
Laboratory methods
Changes in biochemical blood parameters , so this analysis is performed when diagnosing myocardial infarction.

- The number of neutrophils increases in the first two days, reaching a peak on the third day. After which it returns to normal levels.
- ESR is increasing.
- The activity of liver transfer enzymes AsAt and AlAt increases.
Such changes are explained by the inflammatory process in myocardial tissue and scar formation. Changes in the level of enzymes and proteins are also detected in the blood, which is important for making a diagnosis.
- An increase in the amount of myoglobin - within 4-6 hours after the onset of pain.
- Creatine phosphokinase (CPK) increases by 50% 8-10 hours after the onset of the disease. After two days it returns to normal.
- Lactate dehydrogenase (LDH) - enzyme activity increases on the second day of the disease. The values return to normal after 1 - 2 weeks.
- Troponin is a contractile protein, the amount of which increases in unstable angina. Its isoforms are highly specific for myocardial infarction.
ECG signs of ventricular extrasystole
Sinus tachycardia is an increase in heart rate of more than 90 per minute while maintaining the correct sinus rhythm.
1) heart rate more than 90 per minute;
2) correct alternation of P waves and QRS complexes;
3) P waves and QRS complexes have the usual shape characteristic of sinus rhythm;
4) it is possible to shorten the PQ interval, but it is not less than
0.12 sec.
The maximum achievable sinus heart rate under high physical loads can be calculated using the formula: 220-age. In practice, when a person reaches 75% of the calculated maximum under load - the so-called submaximal heart rate - is considered sufficient and exceeding this limit is not recommended.
1) the presence before each tachycardic QRS complex of a P wave of altered shape or polarity (for example, negative P in leads II, III, aVF);
2) ventricular QRS complexes are not changed;
3) it is possible to extend the PQ interval by more than 0.20 seconds.
The frequency of atrial tachycardia is relatively small and rarely exceeds 130 bpm. If the P waves consistently change shape or even polarity during a paroxysm, one can think of a multifocal
(polytopic) atrial tachycardia.
1) the presence of negative P waves merging with the QRS complex or following the QRS complex and overlapping the ST segment;
2) ventricular QRS complexes are not changed.
The average rate of AV nodal paroxysmal tachycardia is about 160 per minute, but can sometimes reach 200 per minute. The paroxysm is triggered by a supraventricular extrasystole with a “critical” coupling interval; after the end of the attack, a post-tachycardia pause is recorded.
Drawing. AV nodal paroxysmal tachycardia.
1) the presence of negative P waves following the QRS complex (RP distance more than 0.1 sec) and overlapping the ST segment or the beginning of the T wave;
2) often deformation and expansion of the ventricular QRS complexes.
3) AV reciprocal paroxysmal tachycardia is observed in WPW syndrome (see ventricular preexcitation syndrome).
1) the presence on the ECG of deformed and widened (more than 0.12 sec) QRS complexes with a discordant location of ST and T, resembling a bundle branch block in shape;
2) dissociation in the activity of the atria and ventricles (the atria are excited from the SA node and the P wave can be recorded on the ECG without a dependent connection with the complex
3) during paroxysm, single unchanged QRST complexes of sinus origin may occasionally be recorded
(“sinus captures”).
Ventricular paroxysmal tachycardia is often high-frequency with a heart rate of 200-220 per minute. Polymorphic (with different shapes of QRS complexes) or bidirectional ventricular tachycardia (Torsade de pointes - “dance of the dots”) with alternating QRS complexes, reminiscent of blockade of the right and left bundle branches during paroxysm indicates pronounced unfavorable diffuse changes in the myocardium and a high risk of developing ventricular fibrillation and sudden death.
Drawing. Ventricular paroxysmal tachycardia
1.premature appearance of the P wave and the complex that follows it
2. distance from the P wave to the QRST complex from 0.08 to 0.12 s;
3. deformation and change in the polarity of the P wave of the extrasystole;
4.presence of unchanged extrasystolic ventricular complex
5. incomplete compensatory pause.
1.premature appearance on the ECG of an unchanged ventricular QRS complex”;
2. negative P wave in leads II, III and aVF after the extrasystolic QRS complex (if the ectopic impulse reaches the ventricles faster than the atria) or the absence of a P wave (with simultaneous excitation of the atria and ventricles (fusion of P and QRS);
3.incomplete or complete compensatory pause.
1.premature extraordinary appearance on the ECG of an altered ventricular QRS complex”;
2. significant expansion and deformation of the extrasystolic complex
3. the location of the S(R)-T segment and the T wave of the extrasystole is discordant to the direction of the main wave of the QRS complex;
4.absence of P wave before the ventricular extrasystole;
5. the presence of a complete compensatory pause after the ventricular extrasystole.
1. a sudden onset and also suddenly ending attack of increased heart rate up to 140-250 per minute while maintaining the correct rhythm;
2. normal unchanged ventricular QRS complexes, similar to the QRS complexes recorded before the attack of paroxysmal tachycardia;
3. absence of the P wave on the ECG or its presence before or after each QRS complex.
1.suddenly beginning and also suddenly ending attack of increased heart rate up to 140-250 bpm with
maintaining the correct rhythm in most cases;
2. deformation and expansion of the QRS complex more than 0.12 s with a discordant location of the RS-T segment and T wave;
3.presence of atrioventricular dissociation, i.e. complete separation of the rapid ventricular rhythm (QRS complex) and the normal atrial rhythm (P wave) with occasionally recorded single normal unchanged QRST complexes of sinus origin (“captured” ventricular contractions).
Additional Research
In some cases, the above studies may not be enough. To definitively establish a diagnosis or clarify the nuances of the course of the disease, the following procedures may be required:
- Chest X-ray . Myocardial infarction may be accompanied by pulmonary congestion. This is noticeable on an x-ray. Confirmation of a complication requires adjustment of the treatment regimen.
- Coronary angiography . Coronary artery angiography helps detect thrombotic occlusion. Determines the degree of decrease in ventricular contractility. This study is carried out before surgical interventions - angioplasty or coronary artery bypass grafting, which help restore blood flow.
To prevent a heart attack, existing angina and coronary heart disease , stress, excessive stress, physical and emotional fatigue should be avoided.
Preparation and execution
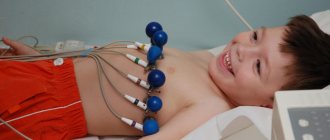
Carrying out the ECG procedure requires careful preparation. Hair on the body where the electrodes are supposed to be placed is shaved off. Then the skin is wiped with an alcohol solution.
Electrodes are attached to the chest and arms. Before recording the cardiogram, set the exact time on the recorder. The main task of a cardiologist is to monitor the parabolas of ECG complexes. They are displayed on a special screen of the oscilloscope. At the same time, all heart sounds are listened to.
ECG performance
A cardiogram for a heart attack is the “gold standard” for diagnosis. The greatest information content occurs in the first hours after the development of the pathological focus. It is at this time during the recording that the signs of myocardial infarction on the ECG are especially acute as a result of the cessation of blood saturation of the cardiac tissues.
The film on which the result of examination of an already developed pathology is recorded reflects the initial disturbance of blood flow, unless, of course, it was formed during the procedure. This is manifested by an altered ST segment in relation to the lines of various leads, which is related to the need for a typical manifestation:
- impaired support through cardiac tissue, which is formed after complete cell death or necrosis;
- changed electrolyte composition. After a heart attack, there is extensive release of potassium.
Both processes require a certain amount of time. Based on this, a heart attack usually appears on the ECG 2–3 hours after the onset of the infarction. The changes are associated with the following processes occurring in the affected area, resulting in its division: necrosis of the myocardium (necrosis), tissue damage, which can then turn into necrosis, insufficient blood supply, which with timely treatment can result in complete recovery.
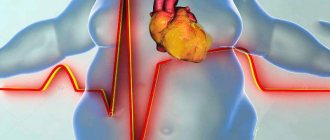
Operating principle of the ECG machine
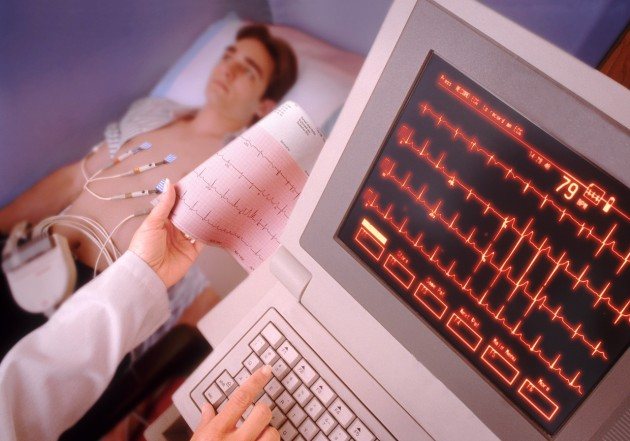
An electrocardiogram is considered the most accessible way to diagnose heart disease.
The compact device is present in almost every clinic and sanitary station, and its dimensions allow it to be transported to emergency calls. The technique is simple and convenient, therefore it is used at the first stage of the examination. It helps doctors make the right decisions based on accurate data. Myocardial infarction is an acute condition in which blood flow to the muscles deteriorates. The disease occurs when a vessel is blocked by a blood clot or atherosclerotic plaque. Stopping blood flow leads to a lack of oxygen in the tissues and provokes the death of cells on the valve wall or septum. Using an ECG, the cardiologist monitors the performance of different departments and receives information about the presence of foci of excitation.
A cardiogram during a heart attack is taken based on the electrical impulses transmitted by the heart muscle. The device package includes:
- voltage pickup device;
- electrical impulse amplification system;
- recording device.
Electrode sensors are fixed on proximal remote areas (wrist, ankle of the patient) and the chest at certain points.
What does a heart attack of different time periods look like on an ECG?
Changes in the ECG appear in accordance with how long ago the pathology developed. This information is extremely important for further treatment. The most striking display occurs in infarcts that have a large volume of affected tissue. During the study, the following stages are determined:
- The acute type of the disease has a time period from several hours to 3 days. On the ECG it looks like a high location of the ST segment relative to the isoline located above the affected area. Due to this, during diagnostics it is impossible to see the T wave;
- The subacute stage lasts from the first day to 3 weeks. The cardiogram shows a slow decrease in the ST segment to the isoline. If the isoline is reached by the segment, then this stage is over. Also during the procedure, negative T is determined;
- the stage of scarring in which a scar is formed. This stage lasts from several weeks to 3 months. During this period, the T wave gradually returns to the isoline. It can be positive. The increased height of the R wave is determined on the tape. If the Q wave is present, its pathological size decreases.
Transmural infarction ECG
Experts divide the stage of transmural infarction into 4 stages:
- The most acute stage, which lasts from a minute to several hours;
- Acute stage, which lasts from an hour to 2 weeks;
- Non-acute stage, which lasts from 2 weeks to 2 months;
- The scar stage, which occurs after 2 months.
Transmural infarction refers to the acute stage. According to the ECG, it can be determined by the rising wave “ST” to “T”, which is in a negative position. At the last stage, Q is formed. The “ST” segment remains on the devices for from 2 days to 4 weeks.
If, upon repeated examination, the patient continues to rise in the ST segment, then he is developing a left ventricular aneurysm.
With a transmural infarction, a Q wave is detected, “ST” moves towards the isoline, “T” expands in the negative zone.
How are heart attacks of different sizes determined?
During a cardiogram, it is possible to identify pathological foci depending on the affected area. If it is located close to the outer wall of the cardiac tissue, an anterior type of infarction develops, which can cover the entire wall of the blood vessel. This will disrupt the blood flow of a large vessel. A small lesion affects the end of arterial branches. There are the following types of pathological lesions.
Large-focal
There are two options. Transmural type, in which the affected area covers the entire thickness of the myocardial wall. In this case, the ECG shows the absence of the R wave, the expansion of the deep Q wave. As a result of the sawn ST segment high above the isoline, the T wave merges with the infarction zone. In the subacute period, a negative T wave is determined.
Large-focal lesions of the subepicardial type are characterized by the location of the affected area near the outer membrane. In this case, a reduced R wave and an increase and expansion of the Q wave are recorded. The S-T complex is located above the area of the infarction, below the lines of other leads. Negative T is determined in the presence of a subacute type.
Finely focal
Subendocardial infarction is defined by damage to the area near the inner lining of the heart. In this case, the ECG will show a smoothing of the T wave. Intramural is characterized by a lesion in the muscle layer. In this case, no pathologies of the Q and R waves are detected.
ECG signs of a heart attack, location
In medical practice, the location of cardiac tissue necrosis is much more common on the left side. The right area suffers less due to the limited load.
Human organs emit weak currents. This ability is used in the operation of an electrocardiograph - a device that records electrical impulses.
Each area corresponds to a specific location in the electrocardiogram:
- Anterior tissue death is characterized by pathology in the thoracic region v1, v2, v3;
- For the side – v3, v4, v5. It occurs rarely, as an independent disorder, manifests itself from the back or front;
- The rear is characterized by a division into lower and upper. With the latter, the R indicator increases in the sector of the left part of the sternum region v1, v2, v3. In the first, deviations are observed in the AVF leads, the area of two sectors.
Variation depending on the location of the pathology
To detect the presence of changes, 12 electrodes must be installed. If there is even the slightest suggestion of a heart attack, then using fewer electrodes is prohibited. Based on the location of the pathological focus, the cardiogram is recorded in different ways.
There are different localizations of the pathological focus:
- anterior infarction is characterized by the departure from the right arm of a deep Q wave, from the right leg - the S-T segment, turning into a negative T wave. Sensors emanating from the chest area record the absence of an R wave, from the right hand - a displacement of the S-T segment;
- lateral infarction is represented by changes emanating from the left arm, right leg in the form of an expanded Q wave, an increase in the S-T segment;
- Q infarction is characterized by changes emanating from the chest electrodes in the form of a significant elevation of the S-T segment, positive T;
- the posterior one shows an altered state emanating from the right leg in the form of a wide Q wave, a positive T wave, which is marked by deformation;
- infarction of the interventricular septum is represented by changes from the left arm, thoracic region. In this case, the lower S-T segment shifts, a positive T wave is determined, and Q deepens;
- Right ventricular infarction on the ECG is quite difficult to determine as a result of the common source of blood flow. Its detection requires the application of additional electrodes.
Additional Information
The above ECG signs of myocardial infarction make it possible in most cases to recognize this terrible disease. However, with some special localizations of the infarction, difficulties arise in its diagnosis. We are talking about myocardial infarctions of high localization, i.e., its location in the basal parts of the ventricles, directly adjacent to the atria.
Anterobasal, or high anterior infarction
For myocardial infarction of this localization, it is characteristic that recording an ECG in 12 generally accepted leads does not allow clearly recording the signs of a heart attack. There is only negativity of the T wave in aVL. However, if you record the chest leads by placing the recording electrode two intercostal spaces above the usual positions, then in such leads the ECG signs of myocardial infarction, which we discussed earlier, will clearly appear.
Posterobasal, or high posterior myocardial infarction
With this myocardial infarction, none of the ECG signs we examined are detected. The only evidence of an existing posterobasal infarction is the +R V1V2 sign, which is understood as an increase in the amplitude of the R wave by more than 1.5 mV in the right precordial leads.
ECG signs of infarction with bundle branch block
A particular difficulty in diagnosing myocardial infarction arises in the case of concomitant blockade of the left bundle branch. In this case, the sinus impulse excites the left ventricle, moving not along the conduction system of the ventricles, but in other ways. Therefore, it is not possible to register direct, familiar signs of myocardial infarction on an ECG tape. However, there are several indirect signs indicating the presence of anterior myocardial infarction of the left ventricle: a) The appearance of a Q wave in the left precordial leads V5 and V6. When the left bundle branch is blocked, the excitation vector of the left ventricle is directed to the recording electrodes V5 and V6, and in this regard there is no Q wave in the left precordial leads. Its appearance during blockade means the presence of necrosis of the anterior wall of the left ventricle. b) No increase in the R wave from lead V1 to V4. Blockade of the left bundle branch is characterized by a gradual increase in the amplitude of the R wave when successively comparing it in chest leads V1—V2—VЗ—V4—V5—V6. With anterior left ventricular infarction, no dynamics of R wave growth are observed. c) The presence of a positive T wave in V5 and V6. One of the ECG signs of left bundle branch block is the discordance of the main wave of the ventricular QRS complex and the T wave. In leads V5 and V6, the main wave of the QRS complex is the R wave, therefore, the T wave with left bundle branch block will always be negative. Its positivity indicates the presence of anterior infarction with left bundle branch block.
The most acute stage of myocardial infarction
A number of researchers identify the most acute stage in the development of myocardial infarction, considering it a time interval from 1-3 minutes to 1-3 hours. Due to the rarity of ECG recording during these periods of development of myocardial infarction, there is no consensus on electrocardiographic criteria, but they believe that the first to be involved subendocardial layers are involved in the process. Therefore, it is logical to assume that the ECG sign of the most acute stage of large-focal infarctions may be signs of subendocardial ischemia or subendocardial necrosis.
The most acute stage of myocardial infarction
Practical tips for analyzing an ECG during a heart attack
The plan for presenting the topic given at the beginning of the chapter, in addition to its direct purpose, also has practical significance. It is in this sequence, as outlined in the plan, that the electrocardiogram should be analyzed for the diagnosis of myocardial infarction: 1. Set up for the diagnosis of large-focal necrosis. 2. Taking the ECG tape in your hands, look for ECG signs of myocardial infarction, concentrating only on the signs. For example, the first sign is a pathological Q wave. Carefully examining each complex in each lead, look only for the Q wave. Having gone through the entire ECG tape, repeat the examination this time with the second sign - the absence or decrease in the height of the R wave. And so on with each sign. 3. Having found these signs, decide on the location of myocardial infarction. The information presented in the lead section will help you with this. It doesn't matter if you weren't able to do it as accurately as possible. 4. Assess the ratio of the height of the R wave and the depth of the Q wave in one infarct QRS complex. This technique will allow you to diagnose transmural or subepicardial infarctions. 5. Determine the stage of the infarction by the relation of the S-T segment to the isoline and visualization of the negative T wave. 6. If the diagnostic search was successful, formulate an electrocardiographic diagnosis, again following the proposed plan, for example: transmural anteroseptal myocardial infarction, subacute stage.
Is it always possible to determine pathology?
Despite the high effectiveness of the method, there are some difficulties that make it difficult to decipher in determining a heart attack using an electrocardiogram. These include excess weight of the subject, which affects the conductivity of the current, detection of new scars is difficult if there are scar changes on the heart, if the conductivity of the block is disrupted, old aneurysms of the heart muscle make it difficult to diagnose new dynamics.
However, provided that modern devices are used, it is possible to carry out automatic calculations of infarction lesions. If you carry out daily monitoring, you can track the patient’s condition throughout the day. ECG is the first method of detecting a heart attack. With its help, pathological foci can be detected in a timely manner, which increases the chance of recovery.
Myocardial infarction without Q wave
Myocardial infarction without a Q wave (non-Q, small-focal infarction) is caused by the formation of extensive zones of ischemia and damage around small foci of necrosis. With this type of infarction, pathological changes in the QRS complex do not occur; only stable signs of transmural ischemia and/or damage are determined (negative T waves, ST displacement), which persist on the ECG for several days. Clinical and laboratory evidence is required to confirm non-Q infarction.
Drawing. Small focal (non-Q) myocardial infarction